Wednesday, February 28, 2018

Statistical Sins: Sensitive Items

Part of my job includes developing and fielding surveys, which we use to gather data that informs our exam efforts and even content. Survey design was a big part of my graduate and postdoctoral training, and survey is a frequently used methodology in many research institutions. Which is why it is so disheartening to watch the slow implosion of the Census Bureau under the Trump administration.

Now, the Bureau is talk about adding an item about citizenship to the Census - that is, an item asking a person whether they are a legal citizen of the US - which the former director calls "a tremendous risk."

You can say that again.

The explanation makes it at least sound like it is being suggested with good intentions:
In December, the Department of Justice sent a letter to the Census Bureau asking that it reinstate a question on citizenship to the 2020 census. “This data is critical to the Department’s enforcement of Section 2 of the Voting Rights Act and its important protections against racial discrimination in voting,” the department said in a letter. “To fully enforce those requirements, the Department needs a reliable calculation of the citizen voting-age population in localities where voting rights violations are alleged or suspected.”
But regardless of the reasoning behind it, this item is a bad idea. In surveys, this item is what we'd call a sensitive item - an item that relates to a behavior that is illegal or taboo. Some other examples would include questions about behaviors like drug use, abortion, or masturbation. People are less likely to answer these questions honestly, because of fear of legal action or stigma.

Obviously, we have data on some of these sensitive issues. How do we get it? There are some important controls that help:
  • Ensure that data collected is anonymous - that is, the person collecting the data (and anyone accessing the data) doesn't know who it comes from
  • If complete anonymity isn't possible, confidentiality is the next best thing - unable to be linked back to respondent by anyone not on the study team, with personal data stored separately from responses
  • If the topic relates to illegal activity, additional protections (a Certificate of Confidentiality) may be necessary to prevent the data collection team from being forced to divulge information by subpoena 
  • Data collected through forms rather than an interview with a person might also lead to more honest responding, because there's less embarrassment writing something than saying it out loud; but remember, overall response rate drops with paper or online forms
The Census is confidential, not anonymous. Data is collected in person, by an interviewer, and personally identifiable data is collected, though extracted when data are processed. And yes, there are rules and regulations about who has access to that data. Even if those protections are held and people who share that they are not legal citizens have no need to fear legal action, the issue really has to do with perception, and how that perception will impact the validity of the data collected. 

When people are asked to share sensitive details that they don't want to share for whatever reason, they'll do one of two things: 1) refuse to answer the question completely or 2) lie. Either way, you end up with junk data. 

I'll be honest - I don't think the stated good intentions are the real reason for this item. We may disagree on how to handle people who are in this country illegally, but I think the issue we need to focus on here is that, methodologically, this items doesn't make sense and is going to fail. But because of the source and government seal, the data are going to be perceived as reliable, with the full weight of the federal government behind them. That's problematic. Census data influences policies, funding decisions, and distribution of other resources. If we cannot guarantee the reliability and validity of that data, we should not be collecting it.

Monday, February 26, 2018

Statistics Sunday (Late Edition): Exogenous vs. Endogenous Variables

I had a busy (but great) Sunday, and completely spaced on writing my Statistics Sunday post! But then, I could just say I posted on Sunday within a certain margin of error. (You've probably heard the one about the three statisticians trying to hit a target. One hits to the left of center, the other to the right. The third yells, "We got it!")

I'm planning on writing more posts on one of my favorite statistical techniques (or set of techniques): structural equation modeling. For today, I'm going to write about some terminology frequently used in SEM - exogenous and endogenous variables.

(Note, these terms are used in other contexts as well. My goal is to discuss how they're used in SEM specifically, as a set-up for future SEM posts.)

Whenever you put together a structural equation model, you're hypothesizing paths between variables. A path means one variable influences/is caused by another. In a measurement model, where observed variables are being used to reflect an underlying (latent) construct, the path from the construct to each of the variables signifies that the construct influences/causes the values of the observed variables.
Created with the semPlot package using a lavaan dataset - look for a future blog post on this topic!
In a path model, it means the same thing - that path means that one variables causes the other - but the variables used in the paths are usually the same kind of variable (observed or latent).
Created with the semPlot package using a lavaan dataset - look for a future blog post on this topic!
For instance, in the figure immediately above, Ind (short for Industrialization) causes both D60 and D65 (measures of democratization of nations in 1960 and 1965). D60, in turn, also causes D65. All 3 are latent variables, with observed variables being used to measure them. Lets ignore those observed (square) variables for now and just look at the 3 latent variables in the circles. Exogenous is the term used to refer to variables that cause other variables (and are not caused by any other variables). Endogenous refers to variables caused by other variables. So in the model just above, Ind is the only exogenous variable: it is caused by 0 (in the context of the model) and causes 2 variables. Both D60 and D65 are endogenous variables: D60 is caused by 1 and D65 is caused by 2.

You may be wondering what we would call a variable that is caused by 1 or more variables, and in turn, causes 1 or more variables. In this terminology, we would still call them endogenous, but we might also use another term: mediator.

Stay tuned for more SEM posts, where we'll start digging into the figures above and showing how it all works! I'm also gearing up for Blogging A to Z; look for a theme reveal on March 19. Spoiler alert: It will be stats related.

Getting Excited for Blogging A to Z!

It's almost March, meaning it's almost time to start thinking about a theme and schedule for Blogging A to Z! This will be my third year participating: last year, I blogged through the alphabet of statistics and the year before that, the alphabet of social psychology. And I have some fun ideas for this year.

The A to Z Challenge Blog is already sharing important dates and a survey for anyone interested in participating. Sign-up opens March 5, and the theme reveal is set for March 19.

Thursday, February 22, 2018

Statistical Sins: Overselling Automation

Yesterday, I blogged about a talk I attended at the ATP 2018 meeting, the topic of which was whether psychometricians could be replaced by AI. The consensus seemed to be that automation, where possible, is good. It frees up time for people to focus their energies on more demanding tasks, while farming out rule-based, repetitive tasks to various forms of technology. And there are many instances where automation is the best, most consistent way to achieve a desired outcome. At my current job, I inherited a process: score and enter results from a professional development program. Though the process of getting final scores and pass/fail status into our database was automated, the process to get there involved lots of clicking around: re-scoring variables, manually deleting columns, and so forth.

Following the process would take a few hours. Instead, after going through it the first time, I decided to devote half a day or so to automating the process. Yes, I spent more time writing the code and testing it than I would have if I'd just gone through the process itself. And that is presumably why it was never automated before now; the process, after all, only occurs once a month. But I'd happily take a one-time commitment of 4-5 hours, than a once-a-month commitment of 3. The code has been written, fully tested, and updated. Today, I ran that process in about 15 minutes, squeezing it between two meetings.

And there are certainly other ways we've automated testing processes for the better. Multiple speakers at the conference discussed the benefits of computer adaptive testing. Adaptive testing means that the precise set of items presented to an examinee is determined by the examinee's performance. If the examinee gets an item correct, they get a harder item; if incorrect, they get an easier item. Many cognitive ability tests - the currently accepted term for what was once called "intelligence tests" - are adaptive, and the examiner selects a starting question based on assumed examinee ability, then moves forward (harder items) or backward (easier items) depending on the examinee's performance. This allows the examiner to pinpoint the examinee's ability, in fewer items than fixed form exams.

While cognitive ability exams (like the Wechsler Adult Intelligence Scale) are still mostly presented as individually-administered adaptive exams, test developers discovered they could use these same adaptive techniques on multiple choice exams. But you wouldn't want to have a examiner sit down with each examinee and adapt their multiple choice exam; you can just have a computer do it for you. As many presenters stated during the conference, you can obtain accurate estimates of a person's ability in about half the items when using a computer adaptive test (CAT).

But CAT isn't a great solution to every testing problem, and this was one thing I found frustrating, because some presenters expressed frustration that CAT wasn't being utilized as much as it could. They speculated this was due to discomfort with the technology, rather than a thoughtful, conscious decision not to use CAT. This is a very important distinction and I suspect it is the case far more often that test develops use paper-and-pencil over CAT because it's the better option in their situation.

Like I said, the way CAT works is that the next item administered is determined by examinee performance on the previous item. The computer will usually start with an item of moderate difficulty. If the examinee is correct, they get a slightly harder item; if incorrect, a slightly easier item. Score on the exam is determined by the difficulty of items the examinee answered correctly. This means you need to have items across a wide range of abilities.

"Okay," you might say, "that's not too hard."

You also need to make sure you have items covering all topics from the exam.

At a wide range of difficulties.

And drawn at random from a pool, since you don't want everyone of a certain ability level to get the exact same items; you want to limit how much individual items are exposed to help deter cheating.

This means your item pool has to be large - potentially 1000s of items, and you'll want to roll-in and roll-out items as they get out-of-date or over-exposed. This isn't always possible, especially for smaller test development outfits or newer exams. At my current job, all of our exams are computer-administered, but only about half of them are CAT. While it's a goal to make all exams CAT, some of our item banks just aren't large enough yet, and it's going to take a long time and a lot of work to get there.

Of course, there's also the cost of setting up CAT - there are obviously equipment needs and securing (i.e., preventing cheating) a CAT environment requires attention to different factors than securing a paper-and-pencil testing environment. All of that costs money, which might be prohibitive for some organizations on its own.

Automation is good and useful, but it can't always be done. Just because something works well - and better than the alternative - in theory doesn't mean it can always be applied in practice. Context matters.


Wednesday, February 21, 2018

From the Desk of a Psychometrician (Travel Edition): Can AI Replace Us?

I'm in San Antonio at the moment, attending the Association of Test Publishers 2018 Innovations in Testing Meeting. This morning, I attended a session on a topic I've blogged about tangentially before - can AI replace statisticians? The session today was about whether AI could replace psychometricians.

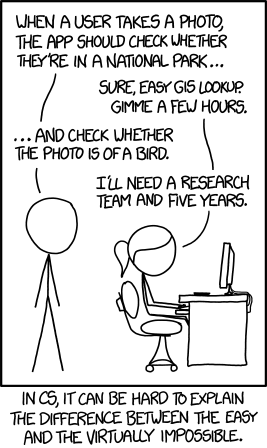
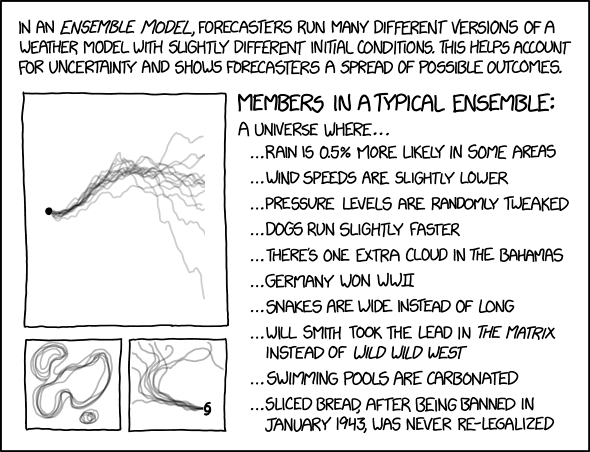
The session had four speakers, one who felt AI could (should?) replace psychometricians, one who argued why it should not, and two who discussed what applications might be useful for AI and what would still need a human. In the session, the speakers differentiated between automation (which is rules-based) and machine learning (teaching a computer to make context-dependent decision-making), or to demonstrate with XKCD:


One involves an automated process of matching the user's location to maps of national parks; the other involves a decision - one that is quite easy for a human - about whether the photo contains a bird. As technology has developed, psychometricians have been able to automate a variety of processes, such as using a computer to adapt a test based on examinee performance or creating parallel forms of a test - something that originally had to be done by a person, but now can be easily done by a computer with the right inputs.

The question of the session was whether psychometricians should move onto using/be replaced by machine learning. Many psychometricians will tell you there is an art and a science to what we do. We have guidelines we follow on, for instance, item analysis - expectations about item function across various groups or patterns of responding, or ability of the item to differentiate between low and high performances (which we call discrimination, but not in the negative, prejudicial sense of the word). But those guidelines are simply one thing we use. We may choose to keep an item with lackluster discrimination if it fulfills an important topic for the exam. We may drop an item performing well because it's been in the exam pool for a while and exposure to candidates is high. And so on.

The take-home message of the session is that automation is good - but replacing us with machine learning is problematic, because it's difficult to quantify what psychometricians do. Overall, to have machine learning take over any process, a human needs to delineate the process and outcomes. Otherwise, the computer has no outcome to which it should target. So even if a computer could take over psychometricians' job duties, it needs information to predict toward.

As machine learning and computer algorithms improve, more problems can be tackled by humans, and perhaps using machine learning for more aspects of psychometrics would allow us to focus our energy on other advances. But to get there, these topics need to be understood by humans first.

Sunday, February 18, 2018

Statistics Sunday: What Are Residuals?

Recently, I wrote two posts about quantile regression - find them here and here. In the first post, I talked about an assumption of linear regression: homoscedasticity, "the variance of scores at one point on the line should be equal to the distribution of scores at other points along the line."


What I was talking about here has to do with the difference between the predicted value (which falls on the regression line) and the observed value (the points, which may or may not fall along the line). This difference is called a residual:

Residual = Observed - Predicted

There is one residual for each case used in your regression, and both the sum and mean of the residuals will be 0. In standard linear regression, which is known as ordinary least squares regression, the goal is to find a line that minimizes the residuals - some residuals will be positive and some will be negative. Remember, when you're dealing with deviations from some measure of central tendency, you need to square them, or else they add up to 0. Your regression line, then, is one that minimizes these squared residuals - least squares.

But, you might ask, why does variance need to be consistent across the regression line? Sure, you want a line that minimizes your residuals, but obviously, your residuals are going to vary to some degree. 

When I first introduced linear regression to you, I gave this basic linear equation you've probably encountered before:

y = bx + a

where b is the slope (measure of the effect of x on y), and a is the constant (the predicted value of y when x=0). But I left out one more term you'd find in linear regression - the error term:

y = bx + a + e

For this error term to be valid, there has to be consistent error - you don't want the error to be wildly different for some points than others. Otherwise, you can't model it (not with a single term, anyway).

When you conduct a linear regression, you should plot your residuals. This is easy to do in R. Let's use the same dataset I used for the quantile regression example, and we'll conduct a linear regression with these data (even though we're violating a key assumption - this is just to demonstrate the procedure). Specify the linear regression using lm, followed by the model outcome~predictor(s):

library(quantreg)
library(ggplot)
options(scipen=999)
model<-lm(foodexp~income, engel)
summary(model)

That gives me the following output:


I can reference my residuals with resid(model_name):

ggplot(engel, aes(foodexp,resid(model))) + geom_point()


You'll notice a lot of the residuals cluster around 0, meaning the predicted values are close to the observed values. But for higher values of y, the residuals are also larger, so this plot once again demonstrates that ordinary least squares regression isn't suited for this dataset. Yet another reason why it's important to look at your residuals.

I'm out of town at the moment, attending the Association of Test Publishers Innovations in Testing meeting. Hopefully I'll have some things to share from the conference over the next couple days. At the very least, it's a lot warmer here than it is in Chicago.

Friday, February 16, 2018

Psychology for Writers: Insomnia

I'm planning to write some posts on sleep deprivation in general and what that might look like, but for today, I thought I'd focus on insomnia, as I see it come up a lot in books and it's not always accurately portrayed.

The word insomnia itself simply means lack of sleep, so in that sense, many characters in books might experience insomnia - being unable to sleep well due to anxiety or excitement, for instance. But the diagnosis of insomnia refers to habitual sleeplessness, with diagnostic criteria usually specifying that the patient should have had difficulty sleeping for at least a month before it can be considered insomnia, and that it should be interfering with the person's ability to function normally (that is, if the person doesn't get much sleep but feels fine, they don't have insomnia - they might just need less sleep than the average person).

There are three ways insomnia can manifest, and patients may have one, two, or all three:
  1. Difficulty initiating asleep - It's considered "normal" to fall asleep within about 15 minutes of getting into bed. For people with insomnia, it can take many minutes or even hours to fall asleep.
  2. Difficulty maintaining sleep - Waking up multiple times in the night and/or waking up early (e.g., before the alarm) and being unable to go back to sleep.
  3. Restless or nonrestorative sleep - Feeling tired, even after getting sleep, likely because the person was unable to go through full sleep cycles and get sufficient amount of sleep in each stage.
When I read books in which characters have insomnia, usually it manifests as #1. But a person might be able to fall asleep normally, but not be able to maintain it, waking up multiple times in the middle of the night and/or being unable to get back to sleep. Books also may portray someone with insomnia as unable to sleep at all, which is highly unlikely. A person with insomnia may be able to sleep for small spans of time, perhaps only making it into the lightest stages of sleep (the stages close to wakefulness). And someone who is severely sleep deprived is likely to fall asleep for short spans of time without meaning to - these are known as microsleeps, where the person may nod off for just a few seconds.

A person may be unaware that they fell asleep, but one tell is that they may have sudden dream-like images - this may happen, especially in a person with insomnia, for a couple of reasons:

1) The lightest stage of sleep is very similar to the stage of sleep in which we dream. In fact, if you look at brain activity of a person in the lightest stage of sleep and in dreaming sleep (REM or rapid eye movement), they'll look surprisingly similar. (Fun fact, they'll also look surprisingly similar to brain activity of a person who is awake.)

2) People with insomnia likely have a deficit of REM sleep. When a person has a deficit of REM sleep, an interesting thing happens that doesn't happen for other sleep deficits: they'll go into REM sleep more quickly and spend more time there. This phenomenon is known as "REM rebound." A person with insomnia may nod off and immediately have dream-like imagery and experiences. This, in fact, is a great explanation for people who report hearing voices, as well as for supernatural experiences; it's no coincidence that people are more likely to report seeing ghosts at night. Auditory and visual hallucinations are very similar to dreams, and are likely the result of the same processes that give us dreams.

The big question, of course, is what causes insomnia. One cause is that a person may be predisposed (genetically) to poor sleep. For instance, I recently did 23andme, and one of the things they look at in their health analysis is whether a person has genetic indicators of being restless during sleep. It makes sense, then, that some people simply don't sleep as well as others for no reason beyond what's written in their genetic code.

Of course, a person may also be genetically predisposed to other conditions that impact sleep, such as depression and anxiety. Insomnia caused by one of these conditions usually occurs because a person is unable to "turn off his/her brain" to fall asleep; instead, they may lay awake worrying or ruminating. But the direction of causality could be flipped, with insomnia causing depression. Sleep is one of the times your body replenishes important neurotransmitters. If your body isn't able to carry out those processes normally done during sleep/rest, they'll experience deficits that could manifest in a variety of conditions.

Among women, hormones can exacerbate insomnia. Many women report having insomnia during their period. (It's likely that hormones affect men's sleep as well, but unlike women, fluctuations in men's hormones are less predictable.) This is more likely to occur among women who have insomnia the rest of the time; it may simply be more severe at certain times in a woman's cycle.

Insomnia is also a symptom of post-concussive syndrome; that is, a person who had a concussion may end up experiencing insomnia. For some, this is short-term until their brain heals. For others, this is a long-term/permanent condition as a result of a head injury. (There are other symptoms of post-concussive syndrome the person may have, such as depression and tinnitus - ringing in the ears.)

Lastly, insomnia may be behavioral. Lack of good sleep hygiene could lead to insomnia. And people who have programmed themselves to be awake at night or to wake up easily at night (e.g., they care for a relative with a chronic illness and have to be awakened multiple times at night) may also end up developing insomnia as a result. However, people who have been diagnosed with insomnia and are working to deal with it tend to have the best sleep hygiene: they avoid things like reading or watching TV in bed, and often won't even have these distractions in their bedroom; they have a standard bedtime routine; and they tend to very thoughtful about what they consume, especially caffeine, close to bedtime. So if you're writing a character who has insomnia, this is one characteristic you could give them: an almost obsessive attention to sleep hygiene.

People with insomnia are also more likely to experience an unbelievably terrifying sleep disturbance: sleep paralysis. I could write a whole post (or two!) about sleep paralysis, which also explains many supernatural experiences. In the meantime, there's a documentary about it available on Netflix. I see insomnia used all the time in books; I rarely see related sleep disturbances like sleep paralysis. So if you're writing a character with insomnia, you might consider adding something like sleep paralysis in as well.

Other quirks of people with insomnia:

  • They may find it difficult to sleep when they're supposed to and difficult not to sleep when they aren't supposed to, such as during the day, while watching TV, etc. 
  • They tend to be better at remembering their dreams, because they often wake up after a dream, and have some time to think about/process it. 
  • They may find it difficult to differentiate dream from reality, not necessarily in the moment, but after the fact. That is, they may remember something later on and be unable to tell if that actually happened or they only dreamed about it.
  • They may be hesitant to tell others they have insomnia because people (usually normal sleepers, who may have a bout of insomnia every so often) will respond with remedies they use when they're unable to sleep. As a person with insomnia since I was about 8 years old - which at its worst, results in me getting only 1-2 hours of sleep a night, and typically, results in me getting 5-6 hours of sleep - I have tried just about everything, and have heard it all, from the mundane to the bizarre to the borderline inappropriate (my favorite, and you're welcome to use it in a book: a Starbucks barista who told me I needed "nature's sleeping pill, which is more of an action," followed by a gesture to make it very clear he was talking about sex). 
Sleep well, writers! And if you don't, use it for story inspiration. 


Thursday, February 15, 2018

So Does that Make it Nine Floyds?

Three Floyds Brewery in Munster, Indiana has plans to triple their current space, with a new glass-walled building that would feature a larger brewpub, outdoor seating, more parking, and of course, more space for brewing:
The plans — which look more like a vision from the tech industry than craft brewing — were posted last week on the town of Munster’s website. Town officials have been hammering out details of the expansion with Three Floyds since September.

Munster Town Manager Dustin Anderson said he expects formal approval by March. The new brewery would likely be completed in 2019 or 2020.

Three Floyds bought multiple lots around its brewery in 2014 to expand brewing production and build a distillery. The new plans calls for Three Floyds to continue building outward from its existing operation, including construction on an undeveloped lot north of the distillery and a lot south of the brewery that formerly housed another business.

“We’re thrilled,” Anderson said. “Three Floyds is a great neighbor and asset for the community, and we’re glad they’re choosing to expand in Munster.”
I'm a big fan of Three Floyds, and have visited their brewpub a couple of times, which can fill up quickly. I can't wait to visit their shiny new facility!

Wednesday, February 14, 2018

Statistical Sins: Not Making it Fun (A Thinly Veiled Excuse to Post a Bunch of XKCD Cartoons)

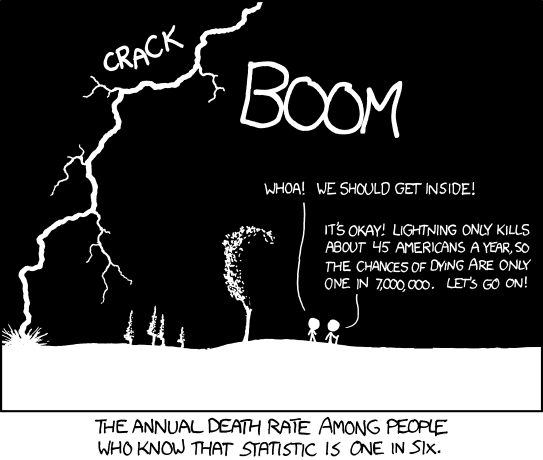
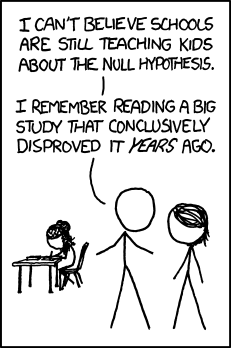
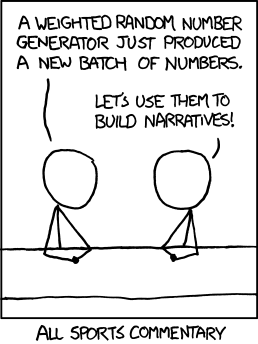
For today's post, I've decided to start pulling together XKCD cartoons corresponding to statistics/probability concepts. Why? Because there are some great ones that will liven up your presentation or lecture. Much like the Free Data Science and Statistics Resources post, this is going to be a living document.

Probability


Outliers

Hypothesis Testing

Null


P-Hacking:


Correlation


Randomness


Visualizing Data


Other Concepts


Tuesday, February 13, 2018

A Work of Art

NASA just released some absolutely breathtaking images of Jupiter, taken by the Juno Spacecraft.


Obviously, the images have been processed to accentuate different elements. You can view the images sent back and do some editing of your own by visiting the JunoCam site. This last one reminds me of a particular work of art:

Snow Way

This story brought a few tears to my eyes - a Chicago man asked, via Twitter, for 10 volunteers to help clear snow for a predominantly elderly community. He got 120 volunteers:
Cole sent out a tweet Friday night asking for 10 volunteers to come to his neighborhood, Chatham, on the South Side of Chicago, to shovel the foot of snow that was accumulating. Chatham is a community that’s largely elderly and African American.

When he went to the train station Saturday morning to see whether anyone had showed up to help, he couldn’t believe what he saw. About 120 people stood on the platform, many with shovels, ready to work.

They came from all backgrounds and all parts of the city.

Cole said that he has been shoveling for his neighbors for years and that for the past several years, he has put out a call for volunteers. In the past, he has gotten about 20 helpers. He said he’s not sure what made so many people respond this year.

“It represents an enthusiasm this city hasn’t seen in a while,” he said.

Monday, February 12, 2018

Things I'm Loving Today

What am I loving today? Well..
  • Chris Stuckman's hilarious review of Fifty Shades Freed:
  • And while we're at it, his spot on review of The Cloverfield Paradox (go watch on Netflix first if you want to see it):
  • For comparison, you can also check out the review of The Cloverfield Paradox from my friend over at Is It Any Good?
  • David Robinson of Variance Explained tells us how to win your office Super Bowl square.
  • And finally, this sign I saw on my walk to work this morning:

Sunday, February 11, 2018

Statistics Sunday: My Favorite R Packages

Last year, I shared a post to help you get started with R and R Studio - check it out here. As I install R on yet another computer, it occurred to me that now might be a good time to blog about the R packages I use so often, installing them is usually my first step right after installing R and R Studio.

Whenever you install R, you'll get the base package, which has many built-in statistics, and some additional libraries. Libraries add functionality to R - you install and load a library to have access to its built-in functions. These libraries/packages are written and contributed by users - some by individuals, some organizations or universities, and some collaborations among users and/or organizations. If you navigate over to the Comprehensive R Archive Network (CRAN) website, you'll find that there are currently 12,133 packages available. There are R packages to do just about anything, and often more than one for any particular statistical approach.

You don't need all of them of course, and may not have any need for most of them. And the packages I use for my own work are likely to be very different from the ones you would need. But my goal for today is to show you the R packages that I think are either universally useful for statisticians, or are just so good, I have to share them with others.

  • dplyr - Part of the "tidyverse" of R packages, this package offers a "grammar" of data manipulation, allowing you to easily filter and mutate (the term used for aggregating data or computing a new variable); this package works on data both in and out of memory, so you can even use it on datasets too large to store in your own computer's memory
  • ggplot2 - Another member of the tidyverse, this one using the grammar of graphics (gg); similar syntax is used to create many different kinds of charts and figures, with just a few changes for type, making it much easier to learn and very flexible
  • psych - Described by the creator, William Revelle of Northwestern University, as a "general purpose toolkit for personality, psychometric theory, and experimental psychology," this package is great for running quick descriptives, data reduction, and psychometric analysis (mostly classical test theory); it also has its own website, filled with resources for learning R
  • lavaan - An easy-to-use package for conducting confirmatory factor analysis and structural equation modeling; I had the pleasure of attending a workshop with one of the developers of the package, Yves Rosseel, a couple of years ago
  • semPlot - Is it possible for an R package to change your life? This package is brilliant; you create your measurement or structural equation model as an R object - to analyze with lavaan or whatever package you choose - then use this package to draw that model for you, with just a line or two of code, complete with factor or path loadings if you'd like. No more hunching over Powerpoint creating figures or accepting the messy drawings produced by SEM software.
  • metafor and rmeta - Two R packages for meta-analysis, which I learned to use in a Meta-Analysis with R course I took a year or so ago. Personally I found the metafor package more useful, but both packages are installed on my computer and have different enough strengths that I could definitely justify installing both
  • RPostgreSQL - Last year, I took a course on SQL, which, after teaching us some basics in PostgreSQL, showed us how to bring SQL data into R; if you, like me, know just enough SQL to be dangerous and prefer to use statistical software to analyze your data, this package will let you pull SQL data into R data frame to be analyzed with whatever package(s) you choose
You can install any of these libraries with install.packages("libraryname") and load a package for use with library("libraryname"). While it's completely fine to have multiple libraries loaded at once, remember that some libraries may use the same function name. R will give the most recently loaded library precedence when functions exist in more than one - and it will let you know when you've loaded a library what functions are now masked from the other loaded libraries.

I tend to measure my productivity by how many R packages I installed that day, so I'm always exploring and learning new approaches and installing new packages. Hopefully I'll do another post like this in the future where I blog about new packages I'm loving.

Sound off, readers - what are your favorite R packages?


Friday, February 9, 2018

Book Review: Sleeping Beauties

You may recall from my reading analysis post that Stephen King was one of the most popular authors among by Goodreads friends. Sleeping Beauties, which came out last year, is the newest book from Stephen King, which he cowrote with his son, Owen King. The book was well-reviewed, even winning the Goodreads award for best horror. I knew I was going to read it eventually, but I was concerned about how long it would take me to work my way through those 700 pages. Surprisingly, not long at all - I finished the book in about a week.


At the beginning of the book is a long list of characters, identifying who they are in relation to other characters. I started reading this but wanted to get started on the actual story, so I skipped on to the book. The character list really wasn't necessary at first, because at the beginning, characters are really in one of two places: a woman's prison and the nearby town of Dooling (a fictional town in the Appalachian region). Only one main character starts outside of Dooling, and the rest were all tied to their locations/roles, so it was quite easy to remember who characters were. As the events of the story moved along, and a new location was introduced, with people from the prison and Dooling, it was nice to have that list to refer back to as a reminder.

The story begins when a stranger comes to town - a half-naked woman who calls herself Eve - who proceeds to go Hulk on a couple of meth dealers, beating them to death. A third man gets away and Eve leaves the woman living with the meth dealers, Tiffany, unharmed. Eve is picked up by Lila, the town sheriff, and taken to the woman's prison, for temporary housing and so she can be evaluated by Lila's husband, Clint, a psychiatrist. In the meantime, the police arrive to take Tiffany's statement about what happened, and are shocked when Tiffany falls asleep and is suddenly wrapped in a white, cottony substance - a cocoon, much like the ones created by moths (which appear throughout the book in many symbolic ways).

Women around the world go to sleep and become wrapped in cocoons, falling to what is dubbed "Aurora syndrome" after the name given to Sleeping Beauty in the Disney movie. If anyone awakens a sleeping woman, she goes into a murderous rage, before falling back asleep. Lila and the other women of Dooling struggle to stay awake, but most fail - and are almost instantly wrapped in a cocoon. In the meantime, Eve, who seems to know something about what is going on with the cocooned women, is able to sleep and awake as normal. Dooling is at the center of whatever is causing women to sleep and cocoon all over the world. This is confirmed after the women who have fallen asleep awaken in another place - but we quickly see, it's only the women of Dooling who appear in this other place. The story then focuses on the mystery of Aurora and Eve.

As I said, the book is a surprisingly quick read for 700 pages. Though it is a detailed story, part of the reason for the length is the multiple subplots and characters. The idea for the story is Owen's, but the number of characters and subplots is pure Stephen. (This is why Stephen King books are often adapted into mini-series instead of movies, to retain as much of the story as possible. I could definitely foresee Sleeping Beauties adapted as a mini-series for Netflix.)

I very much enjoyed this book and would highly recommend it. Though Stephen King is well-known for being a horror writer, I personally wouldn't classify this book as horror - it's fantasy mystery/speculative fiction, with some elements of suspense (and a healthy dose of feminism). Nothing is really that scary, or even unsettling in the way some light horror can be. So if you're not a fan of horror, don't let the horror label scare you away from Sleeping Beauties. The book will make you think and laugh, but I highly doubt it will scare you, unless you have a phobia of moths. And if you are a fan of horror, you may not find it here, but what you will find is a very satisfying story.

Wednesday, February 7, 2018

Statistical Sins: Olympic Figure Skating and Biased Judges

The 2018 Winter Olympics are almost here! And, of course, everyone is already talking about the events that have me as mesmerized as the gymnasts in the Summer Olympics - figure skating.

Full confession: I love figure skating. (BTW, if you haven't yet seen I, Tonya, you really should. If for no other reason than Margot Robbie and Allison Janney.)

In fact, it seems everyone loves figure skating, so much that the sport is full of drama and scandals. And with the Winter Olympics almost here, people are already talking about the potential for biased judges.

We've long known that ratings from people are prone to biases. Some people are more lenient while others are more strict. We recognize that even with clear instructions on ratings, there is going to be bias. This is why in research we measure things like interrater reliability, and work to improve it when there are discrepancies between raters.

And if you've peeked at the current International Skating Union (ISU) Judging System, you'll note that the instructions are quite complex. They say the complexity is designed to prevent bias, but when one has to put so much cognitive effort into understanding something so complex, they have less cognitive energy to suppress things like bias. (That's right, this is a self-regulation and thought suppression issue - you only have so many cognitive resources to go around, and anything that monopolizes them will leave an opening for bias.)

Now, bias in terms of leniency and severity is not the real issue, though. If one judge tends to be more harsh and another tends to be more lenient, those tendencies should wash out thanks to averages. (In fact, total score is a trimmed mean, meaning they throw out the highest and lowest scores. A single very lenient judge and a single very harsh judge will then have no impact on a person's score.) The problem is when the bias emerges with certain people versus others.

At the 2014 Winter Olympics, the favorite to win was Yuna Kim of South Korea, who won the gold at the 2010 Winter Olympics. She skated beautifully; you can watch here. But she didn't win the gold, she won the silver. The gold went to Adelina Sotnikova of Russia (watch her routine here). The controversy is that, after her routine, she was greeted and hugged by the Russian judge. This was viewed by others as a clear sign of bias, and South Korea complained to the ISU. (The complaints were rejected, and the medals stood as awarded. After all, a single biased judge wouldn't have gotten Sotnikova such a high score; she had to have high scores across most, if not all, judges.) A researcher interviewed for NBC news conducted some statistical analysis of judge data and found an effect of judge country-of-origin:


As a psychometrician, judge ratings are a type of measurement, and I personally would approach this issue as a measurement problem. Rasch, the measurement model I use most regularly these days, posits that an individual's response to an item (or, in the figure skating world, a part of a routine) is a product of the difficulty of the item and the ability of the individual. If you read up on the ISU judging system (and I'll be honest - I don't completely understand it but I'm working on: perhaps for a Statistics Sunday post!), they do address this issue of difficulty in terms of the elements of the program: the jumps, spins, steps, and sequences skaters execute in their routine.

There are guidelines as to which/how many of the elements must be present in the routine and they are ranked in terms of difficulty, meaning that successfully executing a difficult element results in more points awarded than successfully executing an easy element (and failing to execute an easy element results in more points deducted than failing to execute a difficult element).

But a particular approach to Rasch allows the inclusion of other factors that might influence scores, such as judge. This model, which considers judge to be a "facet," can model judge bias, and thus allow it to be corrected when computing an individual's ability level. The bias at issue here is not just overall; it's related to the concordance between judge home country and skater home country. This effect can be easily modeled with a Rasch Facets model.

Of course, part of me feels the controversy at the beginning of the NBC article and video above is a bit overblown. The video fixates on an element Sotnikova blew - a difficult combination element (triple flip-double toe-double loop) she didn't quite execute perfectly. (She did land it though; she didn't fall.)

But the video does not show the easier element, a triple Lutz, that Kim didn't perfectly execute. (Once again, she landed it.) Admittedly, I only watched the medal-winning performances, and didn't see any of the earlier performances that might have shown Kim's superior skill and/or Sotnikova's supposed immaturity, but I could see, based on the concept of element difficulty, why one might have awarded Sotnikova more points than Kim, or at least, have deducted fewer points for Sotnikova's mistake than Kim's mistake.

In a future post, I plan to demonstrate how to conduct a Rasch model, and hopefully at some point a Facets model, maybe even using some figure skating judging data. The holdup is that I'd like to demonstrate it using R, since R is open source and accessible by any of my readers, as opposed to the proprietary software I use at my job (Winsteps for Rasch and Facets for Rasch Facets). I'd also like to do some QC between Winsteps/Facets and R packages, to check for potential inaccuracies in computing results, so that the package(s) I present have been validated first.

Tuesday, February 6, 2018

Book Review: Stories of Your Life and Others

A friend sent me a copy of this collection of stories, Stories of Your Life and Others, and I just finished reading it over the weekend. You may not be familiar with the author, Ted Chiang, but you're probably familiar with a movie based on his work: Arrival. Now that I have a bit of time on my hands, I thought I'd sit down and write a quick review. (I also hope to write reviews for the two other books I finished recently: Sleeping Beauties and Weapons of Math Destruction, so stay tuned.)


Tower of Babylon - Unlike the other stories, which take place in a similar time period as our own (perhaps in the not-too-distant future), this story takes place in the distant past: the building of the tower of Babylon. The tower has been built, and miners have been brought in to complete the goal: to mine into the vault of Heaven. The story is told from the viewpoint of one of the miners, as he and his colleagues make their way to the top of the tower. It takes 4 months to reach the top. Communities are built at different points in the tower, and gardens are built to provide food. The miner is skeptical as to whether this undertaking is a good idea, while the builders have no doubts, and those who live on the tower have no desire to go back down to earth. I really felt the creeping discomfort as they went higher in the tower (probably in part because I'm afraid of heights).

Despite taking place in the past, the story explores a more modern issue that comes up with regard to science and technology: just because you can do something doesn't mean that you should.

Understand - This is the standout of the collections, though I enjoyed all of the stories. Leon Greco fell into a frozen lake and spent an hour underwater. But he is saved from braindeath by Hormone K, an experimental treatment for people with brain damage. Not only does he recover, he comes back with more cognitive ability than he had before. He volunteers for a study of Hormone K, so that he can receive more, and becomes addicted to his increased intelligence. As his abilities increase, he is able to get control over his own meta-cognition, suddenly able to literally program his brain.

The story is a great example of speculative fiction: what would happen if we suddenly become this intelligent? He reaches a point where he doesn't sleep, just rests and hallucinates (which is what happens to us when we're deprived of sleep too long; one could argue dreams are phenomenologically similar to hallucinations). This makes a lot of sense to me: Leon reaches a point where he has control over every system of his body, essentially making his entire brain capable of executive function (a much cooler and more accurate version of the "we only use X% of our brain"), but the cost of that may be that he needs to maintain conscious control over all of his bodily functions, like heartrate and breathing.

One of many things I got out of this story is the issue with such extreme levels of intelligence (and one could probably argue, this issue is also true for people of much lower levels of intelligence): there's no persuading them. To persuade someone, they have to, at some level, think they could be wrong. If a person doesn't recognize that they're wrong, either because of inability to consider other viewpoints or because of extreme intelligence, there's no way to change their mind.

In fact, this issue of communication and trying to make another person understand your viewpoint is a recurring theme in this collection. When you are finally able to understand and see something the way the other person does, it changes you.

Division by Zero - This story follows the lives and marriage of two academics: a mathematician and a biologist, showing how our mental life can strongly impact our emotional and romantic life. The mathematician makes a discovery that rocks her entire worldview, and she tries to help her husband understand while also dealing with the aftermath of her discovery. It explores the cost of discovery, touching back on the issue of can do something versus should. Any more information about the story would probably spoil it, since it's a short read.

Story of Your Life - This is the story on which Arrival is based. Many elements from the story made their way into the movie, though there are a lot of big differences. I really enjoyed learning more about the heptopods and their language; the story answers a few of the key questions I had after watching the movie. I could also understand some of the differences, and why they changed different aspects for the movie. I'd highly recommend anyone who saw the movie, regardless of whether you liked it, read this story.

Seventy-Two Letters - This story blends science and technology with religion and fantasy. It follows Robert, who builds simple golem (clay figures brought to life with a name) as a child and in his adulthood, creates complex golem that can take on many human tasks. The key issue here seems to be that gray area between can and should. Every new technology has consequences, many of them unintended. But the key question, that doesn't have an easy answer, is: do the consequences outweigh the benefits?

I recognized at the very beginning of the story that this was about golem (full disclosure: I know what golem are and how they work from an episode of Supernatural, not because I'm some expert). While I thought it was a cool idea, I was a bit disappointed with this story. It didn't feel as cohesive as the other stories in the collection.

The Evolution of Human Science - The shortest of the collection, this story is kind of a follow-up to Understand. A drastic increase in cognitive ability has created a new species: metahumans. Humans, long the most intelligence creatures, have to now deal with a more intelligent lifeform. Metahumans go in their own direction regarding scientific inquiry, and share little with humans, because humans don't have the ability to understand. It's the proverbial question in most close encounter literature: would more intelligent  lifeforms even bother with us or would they view communication with us in the same way we would view communicating with a cockroach?

Hell is the Absence of God - A great example of world-building in a short story, an ability I greatly admire. In this alternate reality, angelic visitation, miracle cures, and death by literal "act of God" are commonplace. The story follows three people impacted by angelic visitation: one whose wife died during a visitation, one who was given a deformity then later healed of it by two angelic visitations, and one trying to find his own purpose in life following his own angelic visitation. Souls are visible, as is their destination (Heaven or Hell), which has both positive and negative consequences for many people in the story. I don't want to say too much that might spoil this story. But one of the things I noticed is that there is actually very little dialogue in the story; instead, the narrator paraphrases many conversations. I wasn't sure I'd like that, but it helped keep the story going at an even pace. I might have to explore dialogue-free writing myself.

Liking What You See: A Documentary - Another excellent example of speculative fiction, that I could see turned into an episode of Black Mirror. (Bad news, that won't happen because, good news, I just learned this story is being adapted for AMC.) Scientists have figured out how to remove value judgments based on appearance, essentially removing the emotional reaction we get when looking at things that are beautiful or ugly. What they are doing is inducing a kind of agnosia (loss of an ability, usually due to brain damage), which they call "calli." This is short for calliagnosia, which I don't think is a real thing, though a related agnosia they discuss, prosopagnosia, the loss of the ability to recognize human faces, is a real thing. The story is the text of interviews with people on different sides of the calli debate - should people do it or not? - as well as news stories covering the topic. The focus is on a single community and the vote by community members as to whether the procedure should be required.

Overall, you can see Ted Chiang's training as a computer scientist, and love of math, work its way into his fiction. But he also shows a strong appreciation for linguistics, and how words have power over our way of thinking and direction in life. This is seen in Story of Your Life, but also Understand and Seventy-Two Letters. His stories also focus heavily on how technology affects us, and the thin line between technology used for good and technology used for evil. I'm looking forward to reading more of his work!

New History of Psychology Book to Check Out

One of my favorite topics is History of Psychology. For every psychology class I teach, I often spend the first lecture giving students historical background on the field/subfield, even if that information isn't discussed in the text. I love tracing the background and showing how our current position is a product of or reaction to everything coming before it.

So I'm always excited to learn about a new History of Psychology book to check out:


William James is responsible for bringing the field of psychology to the United States, and is considered the founder of the functionalism school of thought. That is, one of the early debates in the field of psychology was structuralism vs. functionalism. Basically, structuralists focused on whether consciousness is the product of definable components (structures of the mind) and functionalists viewed consciousness as an active adaptation to one's environment, resulting from complex interactions (focused on function of the mind, rather than the individual components). So you can think of these schools as trees vs. forest focus.

You are probably also familiar with James's brother, novelist Henry James (who wrote The Portrait of a Lady and The Wings of the Dove) and possibly his sister, Alice James (who suffered from life-long mental illness and published her diaries on the topic).

James is well-known for his two-volume Principles of Psychology (which is public domain and can be found here). This new book can be a companion piece to that book and helps place James's work in its historical context.

If only I hadn't made a New Year's Resolution to purchase no books...

Monday, February 5, 2018

Afternoon Reading

I'm currently working from home, meaning I'm sitting on my couch, watching the snow falling as I write this. I'll be driving into the city later this afternoon. For now, I'm happy to be in my warm apartment.

Here's what I'm reading this afternoon:

Sunday, February 4, 2018

Statistics Sunday: Quantile Regression (Part 2)

Last Sunday, I wrote about quantile regression and gave the basics of how it worked. I used the example of when I first analyzed data using quantile regression, in working with data following a growth curve. Specifically, I was analyzing data from an individually-administered adaptive language survey. The important thing to know about this kind of battery is that each test is one continuous unit, with items ranging from very easy to very difficult. But no one would complete all items; the test administrator would only have the examinee take however many items were necessary to determine their ability level. (Anyone administering this battery and others like it have specific training to help them understand how to do this.)

That ability level, of course, is determined based on which specific items the examinee answers correctly. But ability level is partially correlated with age - the easiest questions at the front of the booklet would generally be administered to the very young, while the most difficult questions at the back are for much older examinees. There's obviously individual variation within age groups, such that an older individual might only receive easier items and tap out before getting to more difficult items, or a younger person might be able to breeze through difficult items.

We were using quantile regression to help determine recommended starting points for a new test added to the battery. Instead of simply using age, we decided to use score on another test in the battery, a test that would be administered prior to administering this one, and that taps a very similar skillset. So we expected to have subgroups in our data, and those groups were strongly related to the score a given individual could achieve on the test; that is, one could only get a very high score if they responded correctly to the difficult items that are beyond most examinees' levels. Factor in that the relationship between our main predictor and our outcome was not linear but quadratic as well as the heteroskedasticity issue, and we had a situation in which quantile regression was a good approach. (As others have pointed out, there are others analysis methods we could have used. More on those in future posts.)

Today, I want to show you how to conduct quantile regression in R, using the quantreg package. I'll also be using the ggplot2 package, so if you want to follow along in R, you'll want to load (install if necessary) both of those packages. Also, the last time I used the quantreg package, I sometimes got my results in scientific notation, which I find difficult to read. If that's the case for you, I recommend suppressing scientific notation.

library(quantreg)
library(ggplot2)
options(scipen=999)

To make it easy for you to follow along, let's use an example dataset that comes with the quantreg package: engel. This dataset contains two variables: household income and annual food expenditures among Belgian working class families; both variables are in Belgian francs. Let's load this data and plot our two variables.

data(engel)
ggplot(engel, aes(foodexp,income)) + geom_point() + geom_smooth(method="lm")


The scores are clustered together at the lowest levels of income and food expenditures, and spread out more as values increase. (Note: If you look at the quantreg documentation on this dataset, you'll see they recommend displaying log-transformed data, which is a useful skill in many situations. Look for a future post on that.) Because we're violating a key assumption of least-squares regression, quantile regression is a good option; it doesn't have any assumptions about heteroskedasticity.

To run the quantile regression, you first want to define what quantiles you'll be using - that is, how many subgroups exist in your outcome variable. For my own data quandary at HMH, I set my number of subgroups as the number of test blocks: groups of items that align with the potential starting points. But you can set those quantiles to be whatever you would like. For instance, let's say you were interested in looking at percentiles by tenths. You could create the following R object, which gives you these percentiles (e.g., 0.1, 0.2, 0.3), that you can call with your quantile regression code:

qs <- 1:9/10

The code for a quantile regression is very simple. You use the function rq, and identify the regression equation in the Outcome~Predictor format. Next, refer to your selected quantiles as tau. Finally, identify your dataset.

qreg <- rq(foodexp~income, tau=qs, data=engel)

View simple results by just calling for your quantile regression object, qreg, or simple results plus confidence intervals with summary(qreg). If you want significance tests (testing whether the constant and slopes are significantly different from 0), use summary(qreg, se = "nid"). This will provide you useful information on how your quantiles differ from each other, such as whether some have nonsignificant slopes or whether slopes become negative for certain groups.

For brevity, I'll only display the simple results, but I'll mention that all constants and slopes are significant:


As you can see, you have information for a regression equation at each level of tau (your quantiles). We can easily plot this information by using the plot code above, with a simple substitution for the geom_smooth:

ggplot(engel, aes(foodexp,income)) + geom_point() + geom_quantile(quantiles=qs)


The nice thing about defining your quantiles with an object, rather than an embedded list in your quantile regression code, is that it's easy to switch out if you find different values would work better. For these data, it may not make sense to use these quantiles. The relationship appears to be linear and quite consistent across quantiles. So it may make more sense to use a single regression line, with tau set to the median:

qreg_med <- rq(foodexp~income, tau=0.5, data=engel)
ggplot(engel, aes(foodexp,income)) + geom_point() + geom_quantile(quantiles=0.5)


Hopefully this is enough to get you started with quantile regression. As I've mentioned before, I'm planning to do more analysis of real-world data, so I'm certain quantile regression will show up again. And since March will be here before we know it, it won't be long before Selection Sunday and March Madness. Perhaps some statistical bracketology is in order?