Friday, June 30, 2017

How the White House Response to Trump's Twitter Attack May Signal a Bigger Problem

Yesterday, Trump once again took to Twitter to mock a woman on her appearance, intellect, and attitude:
President Trump lashed out Thursday at the appearance and intellect of Mika Brzezinski, a co-host of MSNBC’s “Morning Joe,” drawing condemnation from his fellow Republicans and reigniting the controversy over his attitudes toward women that nearly derailed his candidacy last year.

Mr. Trump’s invective threatened to further erode his support from Republican women and independents, both among voters and on Capitol Hill, where he needs negotiating leverage for the stalled Senate health care bill.

The president described Ms. Brzezinski as “low I.Q. Crazy Mika” and claimed in a series of Twitter posts that she had been “bleeding badly from a face-lift” during a social gathering at Mr. Trump’s resort in Florida around New Year’s Eve. The White House did not explain what had prompted the outburst, but a spokeswoman said Ms. Brzezinski deserved a rebuke because of her show’s harsh stance on Mr. Trump.

The tweets ended five months of relative silence from the president on the volatile subject of gender, reintroducing a political vulnerability: his history of demeaning women for their age, appearance and mental capacity.
When asked during the White House press briefing, Sarah Huckabee Sanders actually defended the President's action, and turned it around as an attack on the media:
“The president has been attacked mercilessly … by that program. And I think he’s been very clear that, when attacked he’s going to hit back. The American people elected somebody who’s tough, who is smart and who is a fighter. It’s Donald Trump. And I don’t think it’s a surprise to anybody that he fights fire with fire."
My favorite part was when she said the President has never encouraged violence. Yeah, we've heard that one before:


But she goes on to ask, "What about the constant attacks that he receives, or the rest of us?" This isn't the first time a statement such as this has been used by the current administration. This tactic is called "whataboutism" and it was frequently used by the Soviet Union:
Whataboutism is a propaganda technique used by the Soviet Union in its dealings with the Western world. When Cold War criticisms were levelled at the Soviet Union, the response would be "What about..." followed by the naming of an event in the Western world. It represents a case of tu quoque (appeal to hypocrisy), a logical fallacy that attempts to discredit the opponent's position by asserting the opponent's failure to act consistently in accordance with that position, without directly refuting or disproving the opponent's initial argument.
In fact the Wikipedia article linked and quoted above contains an entire section on Trump's use of whataboutism. Now, to be fair, regular people use this tactic as well - this isn't purely a propaganda statement. But it is troubling when an administration uses it to deflect criticism without responding to it or making any changes because of it. I've already commented on some of the dangerous directions the current administration is taking. This is another manifestation of a frightening trend.

Thursday, June 29, 2017

How Hamilton Works

I've sung the praises of Hamilton both in person and on this blog, here and here, going into the intricacies I notice in the play - similarities in melodies to highlight similarities in characters, Hamilton's flaws that make him almost a Greek tragic hero, and so on. So I'm excited to discover Howard Ho's YouTube channel, which includes videos on "How Hamilton Works":


For instance, what does the "Ten Duel Commandments" have in common with the music of Bach? How does Hamilton use key signatures, melodic lines, and cadences to text paint? And that's just what you'll learn in one of the How Hamilton Works videos.

This Morning's Reading and Listening List

These days, I like to start my morning by listening to two podcasts before hopping on my computer - The Daily from the New York Times and Up First from NPR. These short podcasts give me the top stories. Often they report the same thing but not always. Today, for instance, The Daily discussed the conflict in Syria and the health care bill, while Up First discusses Cardinal Pell, a top adviser to Pope Francis who has been charged with sexual assault, and the parts of the travel ban that will be implemented soon (possibly today).

So now I'm on my computer and pulling up links to check out today:
  • Anna Maria Barry-Jester of FiveThirtyEight reminds us that access to care is about more than insurance
  • Also on FiveThirtyEight, Kathryn Casteel discusses the lack of good data to help us understand drug use in the United States; for instance, according to the CDC, heroin deaths have increased from 2000 in 2002 to 13,000 in 2015, but the National Survey on Drug Use and Health suggests heroin use has only doubled during that time, meaning the data could be wrong
  • Michael Reed, who self-identifies strongly as a Christian, keeps destroying Ten Commandments statues on government property; he did it again yesterday at the Arkansas Capitol

Wednesday, June 28, 2017

Pokémon Do Not Pass Go

When the mobile game, Pokémon Go, was introduced, many people were excited about a game that forced people to get outside and get moving. In order to catch different varieties of Pokémon, hatch eggs, and train/fight in gyms, you pretty much had to go outside your home. While this is a great thing, people also noticed the downsides to this game, like encouraging trespassing or entering dangerous areas. Parks saw increased congestion and litter.


This is why Milwaukee decided to require permits for Pokémon Go playing public parks:
In February, the city started complaining about the congestion it was facing at its public parks. At one park in particular -- Lake Park which sits next to Lake Michigan -- there would sometimes be thousands of residents who would visit the local landmark, meet and greet other players, and enjoy one of the great natural formations of the United States.

Or, as Milwaukee County Supervisor Sheldon Wasserman eloquently described it in a local CBS story, "basically absolute hell." He complained about overtime pay for law enforcement, occasional traffic congestion, and overflowing trash.

In response, rather than buying more trash cans, the county enacted an ordinance that required the creators of Pokémon Go -- or any company that would ever want to create a similar game -- to register for a permit and pay a fee of up to $1,000. Wasserman said in the same story that legal action would be a possibility for noncompliance.
Obviously, this ordinance wouldn't affect individual gamers, but rather Niantic, the company that created Pokemon Go. But this ordinance is practically impossible to follow because of the information needed for the permit application - usually things like estimates of the number of attendees, a time period in which people would be present, and plan for cleaning up after the event. But the thing about Pokémon Go is that a person can play it whenever and wherever they want by opening the app. Though they might be able to gather some data on time periods in which players are in a particular park, it seems unlikely that Milwaukee would grant a blanket permit. There's also liability coverage event organizers have to carry.

So, not surprisingly, Milwaukee is being sued:
It still stands, though, which is why another augmented reality developer, Candy Labs AR, has brought forth a lawsuit against Milwaukee County, claiming the ordinance violates First Amendment rights. Under the legally binding rule, any augmented reality game that is played in a Milwaukee public park must be insured by the game developer to cover up to $1 million in liability coverage.

In other words, if someone playing Pokémon Go or any other type of game crashes his car into a park bench or even into a park employee, it would be the developer of the game -- in addition to the individual who crashed his car -- who would be responsible for the financial ramifications of that.

[A] preliminary trial date has been set for April 2018.

The Healthcare Debate Gets More Complicated

Repealing and replacing the Affordable Care Act was one of the President's key campaign promises. In fact, many people who said they voted for Trump did so because they believed he could fix healthcare in our country - though sadly some of them were themselves covered by thanks to the Affordable Care Act, and mistakenly believed Obamacare was something else. It seems misunderstanding about the healthcare system, policy, and how it works goes all the way up to top:


As this post in Talking Points Memo (via The Daily Parker) points out, the healthcare debate comes down to very different fundamental beliefs:
Pretending that both parties just have very different approaches to solving a commonly agreed upon problem is really just a lie. It’s not true. One side is looking for ways to increase the number of people who have real health insurance and thus reasonable access to health care and the other is trying to get the government out of the health care provision business with the inevitable result that the opposite will be the case.
When I've spoken to people who believe ACA should be repealed (and maybe replaced), I've generally heard arguments that ACA and similar policies take out the guesswork for the public, putting the onus on healthcare organizations to meet certain standards, offer specific services, and so on. What people of this opinion believe is that the public should be able to make decisions and "vote with their feet" - if a certain healthcare organization is not delivering on the standards needed for quality care (as defined by the Institute of Medicine: e.g., timely, accessible), people will simply leave that healthcare organization and seek their care elsewhere. This will incentivize healthcare organizations to be as high quality as possible and to innovate.

I don't point this out during these discussions, but do notice that people espousing the above opinion 1) have never worked in health care and 2) are young and healthy. Not to say young, healthy people who have never worked in health care can't be of a different opinion on the matter. It's just something I've noticed.

The problem with letting the markets guide healthcare organizations to better care is that health care is infinitely more complicated. Even if you don't think health care is a right, the idea that regular citizens can obtain all the education they need to make informed choices for care lets healthcare organizations and personnel off the hook.

The 80-20 rule (that 20% of some group accounts of 80% of resources) is as true in health care as it is in wealth distribution: about 20% of people use 80% of healthcare resources. Mostly, these are the sickest among us. The remaining 80% are either relatively healthy and don't need as much care, or don't use healthcare for one reason or another. That small proportion of people using a great deal of care have very complicated medical histories. Each additional condition - and potential treatment options - complicates their case sometimes exponentially. This requires strong care coordination among providers. The best way to do this and ensure providers are speaking to each other is to receive all care in the same organization, but the next best way is to ensure that each provider has access to full information about a person's medical history. And we still do not have a universal medical record that people can simply move from one organization to another. There are far too many issues with regard to privacy and information security that have not been resolved. So at the moment, unless an organization has a direct connection to another to share medical records (and some do), the onus is on the patient to either share these records - sometimes incurring substantial costs with copying and sending records - or to remember the pertinent aspects of their medical history when seeing a new provider. This very issue is also why I think the use of vouchers for VA patients is a very bad idea.

Not to mention that the ACA was about more than insurance coverage. It also included provisions to increase research into outcomes that really matter to patients as well as research that would identify best treatment for a specific patient (that is, best given their needs and values, and not simply what has been shown in large, homogenous clinical trial groups to be most effective). The ACA was about innovation in care. I wonder what aspects of that, if any, will be present in the replacement policy.

And to add yet another level to this complicated debate, Laura Bliss from CityLab reports why the minimum wage debate is also relevant to the healthcare debate. (I have to admit, when I first heard Kellyanne Conway say that people who will be thrown off Medicaid could just get a job to get benefits, I thought, "Of course if she sees that a buffoon like herself and Sean Spicer can get a job, she must think it's pretty damned easy.")

And of course, the ongoing debate about vaccinations and the decision of some parents to withhold some or all of the recommended vaccinations - as well as outbreaks of once-eradicated, often deadly conditions - is also relevant here.

And those are just the issues I thought of off the top of my head. There's a lot more to this. Yeah, no one knew how complicated this could be. </sarcasm>

Tuesday, June 27, 2017

That's a Lot of Beer

Apparently, I've checked over 175 American beers on Untappd:


I was also reminded by Untappd today that this is my one year anniversary of using the app. So in the last 365 days, I've checked in 175 different American beers - not to mention other, non-American beers. 

I feel I should mention these were not always full pints - usually they were tasters and/or flights. 

I'm both proud of myself and concerned I look like an alcoholic. I just really like beer. 

Reading, Writing, and Arithmetic

Thanks to all my travel recently, and some unexpected free time, I've been doing a lot of reading lately. I set my reading goal at the beginning of this year at 24 books - I've already read 20. So I decided to double my reading goal to 48:


I'm now technically "behind schedule" but I'll be doing a lot of reading in the next week (more travel), so I'm sure I'll catch back up. I also cleaned out my bookshelves recently, putting books I'm unlikely to read/reread anytime soon into storage, and created two new shelves for myself: my to-read books, one shelf devoted to fiction and the other to non-fiction. As I read through these two shelves, I'll swap those books out for books in storage and/or new books.

And July is almost here, which is Camp NaNoWriMo:
Camp NaNoWriMo is a virtual writer’s retreat, designed for maximum flexibility and creativity. We have Camp sessions in both April and July, and we welcome word-count goals between 30 and 1,000,000. In addition, writers can tackle any project they’d like, including new novel drafts, revision, poetry, scripts, and short stories.
Basically, unlike NaNoWriMo, where the goal is to write 50,000 words toward a novel, Camp NaNoWriMo lets you pick any kind of project you want, not just a novel, and you can customize your writing goals. In fact, because the project type is flexible, you have some flexibility on what sort of metric you want to use - like a page-count instead of word-count.

I've decided to work on a project I've been thinking about since Blogging A to Z in April: a book on statistics. I'm still undecided on whether it will be a textbook or something a bit more mainstream. I think I'll take advantage of the flexibility of Camp NaNoWriMo and just start writing to see where it goes. I have a list of topics, which I plan to flesh out into a chapter outline in the next few days, and I'll drawing heavily from posts I've already written.

Monday, June 26, 2017

Reading Rainbow for Grown-Ups

I've gotten really into podcasts recently, in part because I'm thinking of doing one of my own and figured this was a good first step before taking the plunge - see what's out there, what works, etc. Last night, I discovered a new podcast I'm so excited to start listening to regularly: Levar Burton Reads.

That's right, Levar Burton, the actor from Roots and Star Trek: The Next Generation, as well as the children's program, Reading Rainbow will read you a piece of adult short fiction once a week. He's already two episodes in! He's also released an introductory episode to let you find out more:


Happy listening!

Sunday, June 25, 2017

Statistics Sunday: Chi-Square - ANOVA for Proportions

Back in May, I blogged about the Analysis of Variance (ANOVA). This test is used when you have 3 or more means and tells you if at least one is significantly different from the expected value, the overall (or grand) mean. But many of the tests I've blogged about so far are only used when your dependent variable is continuous. What if you have an outcome variable that is categorical or ordinal?

For example, your dependent variable might be a two-level outcome - such as pass or fail, survived or didn't survive, Coke or Pepsi. In my research methods course, I would bring in photo copies of old yearbooks, and we would do a smiling study. First, we had to create a good operational definition for smile, to make sure we were coding consistently. After all, people have very different personal definitions and continually disagree on what is and is not a smile:


We would then go through the yearbook pages and code whether a person is smiling. We'd generate hypotheses about whether men or women would be more likely to smile or differences in smiling by grade. But at the end of the coding, we have a bunch of binary data - frequencies and proportions. What statistical test can we use to test our hypotheses?

Remember that when we have continuous outcomes, the mean is our expected value. And when we conduct ANOVA, our expected value is the grand mean. But when we have binary outcomes (or even a multi-level outcome where the mean would be meaningless - pun fully intended), we have to use a different expected value. We use how we would expect our frequencies to fall in the various groups by chance alone - that is, if there is no relationship between the groups and the outcome.

Let's use our smiling study as an example, and we'll test the hypothesis that women are more likely to smile than men. This gives us a simple chi-square between two groups with a binary outcome. The table we get as a result is called a 2 x 2 contingency table. Say that we went through and coded all 1,000 students in a high school - freshmen through seniors - and found that overall, 700 of them were smiling and 300 were not, or as percentages, 70% are smiling and 30% are not. These are our expected values for our groups. If there is no relationship between gender and smiling, we would expect 70% of men and 70% of women to smile.

We compare these expected values to our observed values. This is the part that looks very much like ANOVA; we subtract each expected value from its respective observed value, then square that difference, because we'll have both positive and negative values (our deviations) and we don't want them to cancel out. Each squared deviation is divided by its expected value and the results are added together. This gives you your chi-square. Like ANOVA, it is always positive, and theoretically has no upper limit. The test statistic has an associated p-value, which you would once again compare to alpha to determine if the difference is large enough to conclude that there is a relationship between gender and smiling.

The chi-square test is also sometimes called a test of independence - that's because it is testing whether the group and outcome variables are independent of each other, meaning not related. As I said above, let's say in our study example 70% of people are smiling. Let's also say that we found that 75% of women and 65% of men were smiling. Are those values different enough from 70% to say there is a gender difference? Let's find out, using R! First, I generated data to match the specifications and turned that into a data frame I can analyze (the very first command suppresses scientific notation, so p-values are easier to read; this is one of the first codes I include with any R script I write):
options(scipen=999999)
women<-sample(0:1, 500, replace=T,prob=c(0.25,0.75))
men<-sample(0:1, 500, replace=T, prob=c(0.45,0.65))

female<-rep("Female",each=500)
male<-rep("Male",each=500)

smile<-c(women,men)
gender<-c(female,male)

smile_data<-data.frame(gender=gender, smile=smile)
Now, we'll create a table of our results - this is often called a cross-table (crosstabs or xtabs for short); the variable listed first will be displayed in rows and the variable listed second in columns:
mytable<-xtabs(~gender+smile, data=smile_data)
mytable
##         smile
## gender     0   1
##   Female 117 383
##   Male   224 276
Finally, we'll run a chi-square, which is really easy to do with the R stats base package. We just request a summary of the table object we created:
summary(mytable)
## Call: xtabs(formula = ~gender + smile, data = smile_data)
## Number of cases in table: 1000 
## Number of factors: 2 
## Test for independence of all factors:
##  Chisq = 31.444, df = 1, p-value = 0.00000002053
As you can see, the p-value is very small, much smaller than 0.05. So we would conclude from these data that there is a gender difference: women are more likely to smile in yearbook photos than men.

That's all for now! In a future post, I plan to explain the concept of degrees of freedom - as you've seen, this is relevant in the different statistical tests we've covered thus far. And if there are any other statistics topics you'd like me to cover, let me know in the comments below!

*Edit: There was an error in my code, where I accidentally switched the 0 and 1 coding. This has been fixed - apologies!

Saturday, June 24, 2017

Historical Children's Literature (And Why I'll Never Run Out of Reading Material)

Via a writer's group I belong to, I learned about the Baldwin Library of Historical Children's Literature, a digital collection maintained by the University of Florida. A past post from Open Culture provides some details:
Their digitized collection currently holds over 6,000 books free to read online from cover to cover, allowing you to get a sense of what adults in Britain and the U.S. wanted children to know and believe. Several genres flourished at the time: religious instruction, naturally, but also language and spelling books, fairy tales, codes of conduct, and, especially, adventure stories—pre-Hardy Boys and Nancy Drew examples of what we would call young adult fiction, these published principally for boys. Adventure stories offered a (very colonialist) view of the wide world; in series like the Boston-published Zig Zag and English books like Afloat with Nelson, both from the 1890s, fact mingled with fiction, natural history and science with battle and travel accounts.
The post highly recommends checking out the Book of Elfin Rhymes, one of many works of fantasy from the turn of the century - similar to a childhood favorite of mine, the Oz book series by L. Frank Baum, a world I continue to visit in my adult life through antique book collecting and occasional rereading. The illustrations of Elfin Rhymes are similar to the detailed illustrations you would find in a first edition (or reprinted vintage edition) of an Oz book:

And if you're looking for more classics (and beyond) to read for free, Open Culture shares a list of 800 free ebooks here. This is a good find considering I'm spending my afternoon cleaning out my bookshelf, putting books I've read (and am unlikely to reread soon) into storage to make room for new. My reading list continues to grow...

Friday, June 23, 2017

Map From the Past

I'm finally home from Colorado. On my flight yesterday (my 8th flight in the last month), I listened to a podcast from Stuff You Should Know on How Maps Work.

On this podcast, I learned about an international incident from 7 years ago that I missed at the time - Google Maps almost started a war:
The frenzy began after a Costa Rican newspaper asked Edén Pastora, a former Sandinista commander now in charge of dredging the river that divides the two countries, why 50 Nicaraguan soldiers had crossed the international frontier and taken up positions on a Costa Rican island. The ex-guerrilla invoked the Google Maps defense: pointing out that anyone Googling the border could see that the island in the river delta was clearly on Nicaragua’s side.
This dispute was one incident in a long line of border disputes between Costa Rica and Nicaragua, dating back to the 1820s. The Cañas–Jerez Treaty was enacted in 1858 to alleviate these tensions, and it seemed to work for a while. The International Court of Justice ruled on this small island in 2015, reaffirming that the disputed piece of land belongs to Costa Rica.

You can read an overview of this dispute here.

Tuesday, June 20, 2017

He's No Frank Underwood

Two special elections are happening today: one in the 6th Congressional district of Georgia - the race receiving the most attention - and one in the 5th Congressional district of South Carolina, which happens to be the home district of fictional politician, Frank Underwood of Netflix's House of Cards. And Democrat Archie Parnell seems to be having a great time highlighting this connection. Check out this campaign ad:


Harry Enten of FiveThirtyEight explains why this special election matters, despite receiving less attention:
Voters in the South Carolina 5th are choosing between Republican Ralph Norman, a former state representative, and Democrat Archie Parnell, a former Goldman Sachs managing director who has been using ads parodying Underwood to draw attention to his campaign.

[T]his is not the type of district where Democrats tend to be competitive. It’s not even the type of district where they need to be competitive to win the House next year. Democrats need a net gain of only 24 seats from the Republicans to do that. And there are 111 districts won by Republican House candidates in 2016 that leaned more Democratic than the South Carolina 5th.

There hasn’t been a lot of polling of the South Carolina race, but what we do have shows that Parnell is outperforming the district’s default partisan lean, just not by nearly enough.

Even if Norman wins, as expected, we will still learn something about the state of U.S. politics. As I’ve written before, when one party consistently outperforms expectations in special elections in the runup to a midterm election, that party tends to do well in those midterms.

So keep an eye on how much Parnell loses by (assuming he loses). The closer Norman comes to beating Parnell by 19 points (or more) — the default partisan lean of the district — the better for the Republican Party. A Parnell loss in the low double digits, by contrast, would be consistent with a national shift big enough for Democrats to win the House.

Monday, June 19, 2017

Alexa, Buy Whole Foods

Back in May, I shared a story from the Guardian that Whole Food's sales are declining and the company would be downsizing. The explanation was a combination of high prices (it's called Whole Paycheck for a reason) and increased availability of organic and specialty products at other grocery stores.

Friday, it was announced that Amazon would be buying Whole Foods:
Wall Street is betting Amazon (AMZN, Tech30) could be as disruptive to the $800 billion grocery industry as it has already proved to be for brick-and-mortar retail businesses.

Amazon already had a relatively small grocery business of its own, Amazon Fresh, but its acquisition of Whole Foods is much more ominous sign for competitors.

Traditional grocers are already struggling with fierce competition and falling prices. Amazon's war chest and online strength, coupled with Whole Foods' brand power, could force grocers to cut costs and spend heavily on e-commerce.

"For other grocers, the deal is potentially terrifying," Neil Saunders, managing director of GlobalData Retail, said in a report on Friday. "Amazon has moved squarely onto the turf of traditional supermarkets and poses a much more significant threat."
And of course, Twitter users had a lot to say about the deal:
Stock prices for other grocers fell Friday, totaling about $22 billion in market value. Obviously this isn't trivial, but after finishing Nassim Taleb's Fooled by Randomness recently, in which he specifically discusses randomness in the market, I'd be more interested in seeing what happens long-term (I'm expecting some regression to the mean soon).

And there's the big question - what will happen to Whole Foods? You can already buy groceries through Amazon, including more "mainstream" products you don't see in Whole Foods. Will Whole Foods become just another grocery store?

Sunday, June 18, 2017

Statistics Sunday: Past Post Round-Up

For today's post, I thought I'd share what I consider my favorite posts on statistics - in this case, favorite means either a topic I really love or a post I really enjoyed writing (and for certain posts, those two are the same thing). Here are my favorite statistics posts:

  • Alpha, one of the most important concepts in statistics, in which I also give a short introduction to probability
  • Error, which builds on probability information from previous posts, and starts to introduce the idea of explained and unexplained variance
  • N-1, a concept many of my students struggled to understand in introductory statistics - this post helped me solidify my thoughts on the topic, and I think I understand it much better for having written about it
  • What's Normal Anyway, my first Statistics Sunday post, which had the added bonus of proving to myself there is a way to explain skewness and kurtosis in a way people understand, and that these don't need to be considered advanced topics
  • Analysis of Variance, which used the movie theatre example I first came up with when I taught statistics for the first time - I remember overhearing my students during their final exam study sessions saying to each other, "Remember the movie theatre..."
I plan on getting back to writing regular posts soon, and have a list of statistics topics to sit down and write about. Stay tuned.

Friday, June 16, 2017

Updates

I haven't blogged in the last few days. Why? I'm back in Colorado again. (Sing that last line to the tune of Aerosmith's Back in the Saddle if you could.) A family health issue called me back and I'm writing this post from a dingy motel room with a large no smoking sign that I find hilarious because the room reeks of smoke - but it was the only place with a room available not too far from the hospital. But hey, I'm in Colorado, so here's what I'm doing for fun:
  • Trying all the Colorado beer - I'm currently having New Belgium Voodoo Ranger IPA in my dingy motel room; but I've recently had: Breckenridge Mango Mosaic Pale Ale; a flight at Ute Pass Brewing Company that included their Avery IPA, High Point Amber, Sir Williams English Ale, and Kickback Irish Red plus a tap guest of Boulder Chocolate Shake Porter; and an Oskar Blues Blue Dream IPA
  • Listening to all the podcasts, including an excellent one about how beer works from Stuff You Should Know, as well as some of my favorite regular podcasts from Part-Time Genius, WaPo's Can He Do That?, FiveThirtyEight Politics, StarTalk, Overdue, and Linear Digressions
  • Enjoying three new albums: Spoon's Hot Thoughts, Lorde's Melodrama, and Michelle Branch's (She's still making music! My college self is thrilled!) Hopeless Romantic
  • Reading The Black Swan: The Impact of the Highly Improbable by Nassim Nicholas Taleb, which Daniel Kahneman said "changed my view of how the world works"; Kahneman, BTW, is a social psychologist with a Nobel Prize in Economics
  • Also reading (because one can never have too many books) Sports Analytics and Data Science: Winning the Game with Methods and Models by Thomas W. Miller - because I've been trying to beef up my data science skills and thought doing it with data I really enjoy (i.e., sports data) would help motivate me
  • Acquiring new skills such as hitching a fifth wheel (sadly I didn't discover or watch this video until long after hitching the fifth wheel), driving about 70 miles with said fifth wheel, and storing said fifth wheel - I'm considering adding these skills to my résumé
Tomorrow, I'm planning to spend a few hours checking out the Colorado Renaissance Festival. For now, here's a picture from the Garden of the Gods today:

Tuesday, June 13, 2017

What Democrats and Republicans Can Agree On

Yesterday, I listened to the FiveThirtyEight podcast in which they discussed "the base" - both Democratic and Republican - and they spent some time trying to operationally define what would be considered the base of these parties.

This is actually surprisingly difficult. As is said in the podcast, ideology (a continuum from liberal to conservative) and party affiliation (e.g., Democrat, Republican) are two different things, and although they do go together sometimes, they can also diverge. Determining whether a person is part of the Democratic or Republican base has to be more than simply determining if they're liberal or conservative. They also have to align with party activities and causes, and have a voting track record aligning with the party.

I highly recommend giving the podcast a listen.

In the podcast, they also talk about the parties more generally and even highlight some of the things Republicans and Democrats can agree on - specifically that the President should stay off of Twitter. So U.S. Representative Mike Quigley's COVFEFE (Communications Over Various Feeds Electronically for Engagement) Act is well-timed:
This bill codifies vital guidance from the National Archives by amending the Presidential Records Act to include the term “social media” as a documentary material, ensuring additional preservation of presidential communication and statements while promoting government accountability and transparency.

“In order to maintain public trust in government, elected officials must answer for what they do and say; this includes 140-character tweets,” said Rep. Quigley. “President Trump’s frequent, unfiltered use of his personal Twitter account as a means of official communication is unprecedented. If the President is going to take to social media to make sudden public policy proclamations, we must ensure that these statements are documented and preserved for future reference. Tweets are powerful, and the President must be held accountable for every post.”

In 2014, the National Archives released guidance stating its belief that social media merits historical recording. President Trump’s unprecedented use of Twitter calls particular attention to this concern. When referencing the use of social media, White House Press Secretary Sean Spicer has said, “The president is president of the United States so they are considered official statements by the president of the United States.”

Sunday, June 11, 2017

Statistics Sunday: Parametric versus Nonparametric Tests

In my posts about statistics, I've tried to pay some attention to the assumptions of different statistical tests. One of the key assumptions of many tests is that data are normally distributed. I should add that this is a key assumption for many of what we call 'parametric' tests.

Remember that in statistics lingo, parameter is the term we use to describe values that apply to populations, whereas statistics are values created with samples. When we try to generalize back to the population, we want our sample data to follow a similar distribution as the population - this distribution is often normal but not always. In any case, anytime we make/have assumptions about the distribution of data, we use parametric tests that include these assumptions. The t-test is considered a parametric test, because it includes assumptions about the sample (and hence, the population) distribution.

But if your data are not normally distributed, there are still many tests you can use, specifically ones that are known as distribution-free or 'non-parametric' tests. During April A to Z, I talked about Frank Wilcoxon. Wilcoxon contributed two tests that are analogues to the t-test, but have no assumptions about distribution.

To be considered a parametric test, it isn't necessary to have an assumption that data are normally distributed, because there are many types of distributions data can follow; an assumption of normality is a sufficient but not necessary condition. What is necessary to be a parametric test is to have some assumption of what the data should look like. If test assumptions make no mention about data distribution, it would be considered a non-parametric test. One well-known non-parametric test is the chi-square, which I'll blog about in the near future.

Saturday, June 10, 2017

Alan Smith on Why You Should Love Statistics

I happened upon this Ted Talk from earlier in the year, in which Alan Smith explains why he loves (and why you should love) statistics - his reason is very similar to mine:

Friday, June 9, 2017

Catching Up on Reading

I've been on vacation (currently in Denver) and haven't made time to blog, although I'm sure I'll be blogging regularly again when we return to Chicago. I'm still keeping up on reading my favorite blogs until now, but today will be spent squeezing in our last bit of Denver sightseeing before flying up to Montana to visit family for the weekend. So here's my reading list for when I get a little downtime at the airport:

Monday, June 5, 2017

Greetings from Colorado

I'm writing this post from my cabin in Woodland Park, CO, about 30 minutes from Colorado Springs. We flew in yesterday afternoon and despite a forecast of rain for our full visit, the weather is sunny and clear. Here's some photo highlights, with more to come:

We'll have to pick up some of this excellently named jerky when we go back to the airport.

The castle rock in the aptly named Castle Rock, CO.

As we got closer to Woodland Park, we drove through these gorgeous tree-populated hills...

and red rocks. I'll get better pictures when we head back to Colorado Springs later today for lunch at a brewery.

Our home for the next couple days in Woodland Park, CO.

Our cute cabin...

and my parents' cute dog, Teddy, who came to greet us shortly after our arrival.

We had a nice view of Pikes Peak at dinner last night. We'll have an even better view when we take the tram up the mountain tomorrow.

And because it's Colorado:


The ashtray right outside our cabin is clearly marked "Cigarettes only." Hmm, what else would people be smoking in Colorado? ;)

Sunday, June 4, 2017

Statistics Sunday: Linear Regression

Back in Statistics in Action, I blogged about correlation, which measures the numerical strength of a linear relationship between two variables. Today, I'd like to talk about a similar statistic, that differs mainly in how you apply and interpret it: linear regression.

Recall that correlation ranges from -1 to +1 (with 0 indicating no relationship, and the sign indicating the direction: one goes up the other goes up is positive and one goes up the other goes down is negative). That's because correlation is standardized: to compute a correlation, you have to convert values to Z-scores. Regression is essentially correlation, with a few key differences.

First of all, here's the equation for linear regression, which I'm sure you've seen some version of before:

y = bx + a

You may have seen it instead as y = mx + b or y = ax + b. It's a linear equation:


A linear equation is used to describe a line, using two variables: x and y. That's all regression is. The difference is that the line is used as an approximation of the relationship between x and y. We recognize that not every case falls perfectly on the line. The equation is computed so that it gets as close to the original data as possible, minimizing the (squared) deviations between the actual score and the predicted score. (BTW, this approach is called least squares, because it minimizes the squared deviations - as usual, we square the deviations so they don't add up to 0 and cancel each other out.)

As with so many statistics, regression uses averages (means). To dissect this equation (using the first version I gave above), b is the slope, or the average amount y changes for each 1 unit change in x. a is the constant, or the average value of y when x is equal to 0. Because we have one value for slope, we assume there is a linear relationship between y and x, that is the relationship is the same across all possible values. So regardless of which values we choose for x and y (within our possible ranges), we expect the relationship to be the same. There are other regression approaches we use if and when we think the relationship is non-linear, which I'll blog about later on.

Because our slope is the amount of change we expect to see in y and our constant is the average value of y for x=0, these two values are in the same units as our y variable. So if we were predicting how tall a person is going to grow in inches, y, the slope (b), and the constant (a) would all be in inches. If we use standardized values, which is an option in most statistical programs, our b would be equal to the correlation between x and y.

But what if we want to use more than one x (or predictor) variable? We can do that, using a statistic called multiple linear regression. We would just add more b's and x's to the equation above, giving each a subscript number (1, 2, ...). There are many cases where more than one variable would predict our outcome.

For instance, it's rumored that many graduate schools have a prediction (regression) equation they use to predict grad school GPA of applicants, using some combination of test scores, undergraduate GPA, and strength of recommendation letters, to name a few. They're not sharing what that equation is, but we're all very sure they use them. The problem when we use multiple predictors is that they are probably also related to each other. That is, they share variance and may predict some of the same variance in our outcome. (Using the grad school example, it's highly likely that someone with a good undergraduate GPA will also have, say, good test scores, making these two predictors correlated with each other.)

So when you conduct multiple linear regression, you're not only taking into account the relationship between each predictor and the outcome; you're also correcting for the fact that the predictors are correlated with each other. So when you're conducting multiple regression, you want to check the relationship between your predictors. If two variables are highly related to each other, to the point that one could be used as a proxy for the other, your variables are collinear, meaning that they predict the same variance in your outcome. Weird things happen when you have collinear variables. If the shared variance is very high (almost full overlap in a Venn diagram), you might end having a variable that should have a positive relationship with the outcome showing a negative slope. This is because one variable is correcting for overprediction; if this happens, we call it suppression. The only way to deal with it is to drop one of the collinear variables.

Obviously, it's unlikely that your regression equation will perfectly describe the relationship between/among variables. The equation will always be an approximation. So we measure how good our regression equation is at predicting outcomes using various metrics, including the proportion of variance in the outcome variable (y) predicted by the x('s), as well as how far the predicted y's (using the equation) are from the actual y's - we call this metric residuals.

In a future post, I'll show you how to conduct a linear regression. It's actually really easy to do in R.

Saturday, June 3, 2017

In Good Taste

Several years ago, while I was still in grad school and teaching college classes regularly, I attended a workshop at the Association for Psychological Science Teaching Institute (which occurs right before the full APS conference). The workshop was a demonstration of different taste perception activities one could use in either an introductory psychology or sensation & perception course. One activity used paper that had been soaked in a bitter tasting chemical (probably phenylthiocarbamide); you placed the paper on the tip of your tongue. This activity allows people to identify whether they're a "super-taster" meaning they have a lot of bitter tastebuds. My reaction to the bitter taste was immediate, meaning I'm a super-taster. I was also one of the youngest people in the room, and the person running the workshop went on to share that children have more bitter tastebuds than adults, which may explain why they don't tend to like bitter-tasting foods, like brussel sprouts or broccoli, as much as adults.

Our tastes really do change over time, and there's also a lot of individual differences when it comes to taste, even among people from the same age-group. This month's FiveThirtyEight Sparks podcast involves a discussion about differences in taste, as well as an interview with Bob Holmes, author of Flavor: The Science of Our Most Neglected Sense:


The group also does some flavor tripping. We did a little of that in the APS workshop, and a few years ago I attended a flavor tripping party with a few friends.

Friday, June 2, 2017

State Maps

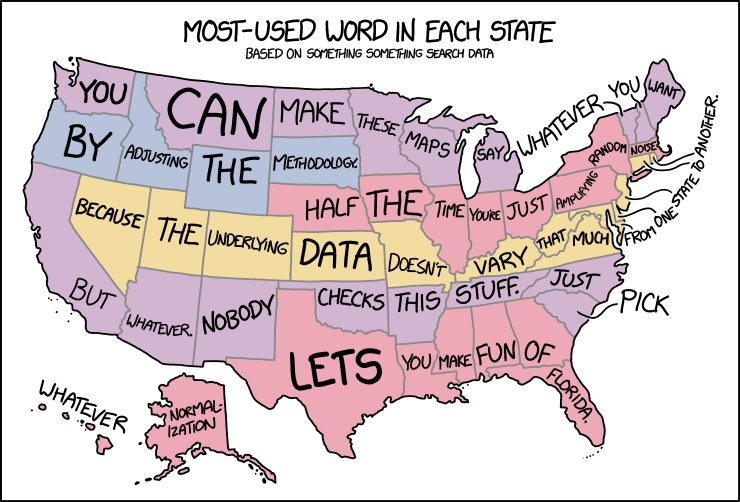
You've probably seen the most recent state map making the rounds, which displays the most often misspelled word in all 50 states. XKCD had a brilliant response: