Showing posts with label lists. Show all posts

Thursday, August 30, 2018

Today's Reading List

I'm wrapping up a few department requests as we head into the end of our fiscal year, so these tabs will have to wait until later:

Back to work.

Wednesday, July 25, 2018

Blogging Break

You may have noticed I haven't been blogging as much recently. Though in some aspects, I'm busier than I've been in a while, I still have had a lot of downtime, but sadly not as much inspiration to write on my blog. I've got a few stats side projects I'm working on, but nothing to a point I can blog about, and I'm having difficulty with writing some of the code on projects I've been plan on writing about. Hopefully I'll have something soon, and will get to back to posting weekly Statistics Sunday posts.

Here's what's going on with me currently:

  • I had my first conference call with my company's Research Advisory Committee last night, a committee I imagine I'll inherit as my own now that I'm Director of Research
  • I submitted my first novel query to an agent earlier today and received a confirmation email that she got it
  • I've been reading a ton and apparently am 5 books ahead of schedule on my Goodreads reading challenging: 38 books so far this year
  • The research center I used to work for was not renewed, so they'll be shutting their doors in 14 months; I'm sad for my colleagues
  • Today is my work anniversary: I've been at my current job 1 year! My boss emailed me about it this morning, along with this picture:

Sunday, July 8, 2018

Statistics Sunday: Mixed Effects Meta-Analysis

As promised, how to conduct mixed effects meta-analysis in R:


Code used in the video is available here. And I'd recommend the following posts to provide background for this video:

Wednesday, May 23, 2018

Statistics in the News

It's been a long road to our new database management system at work, and while we're still working through issues with vendors, I think we're finally going to be able to publish exam scores to our new system today. (Wish me luck!) In the meantime, here are some statistically-themed news stories I'll have to read later:
  • 99% - that's how many requests for access to experimental drugs and treatments are approved by the FDA under the "compassionate use" program; even so, Congress passed a bill providing increased access to experimental treatments
  • 5 - the number of eviction notices these parents sent to their 30-year-old son still living at home; a judge agreed it's time for him to move out
  • 46% and 50% - the percentage of urban and rural residents, respectively, who report drug addiction as one of the biggest problems in their community
  • Less than 20 minutes - how long it will take you to listen to Dr. Frank Newport's 5 key polling insights in this Gallup podcast
  • June 27 - the date of the grand opening of the National Museum of Psychology at the University of Akron

Sunday, March 25, 2018

Statistics Sunday: Countdown to Blogging A to Z

April 1st is one week away and Blogging A to Z will officially begin! (No fooling!)

I'll be blogging my way through the alphabet of R. Here are some past posts that might be useful to help prepare to analyze along with me - if you're so inclined:

That's all for now!


Wednesday, February 14, 2018

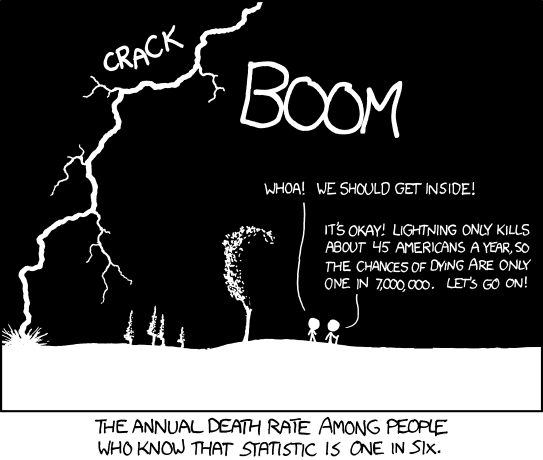
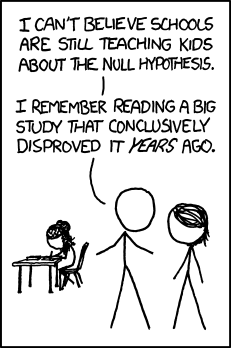
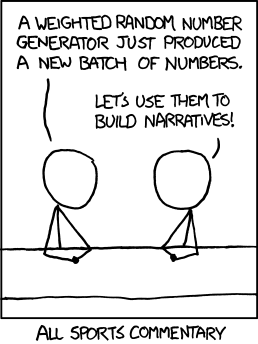
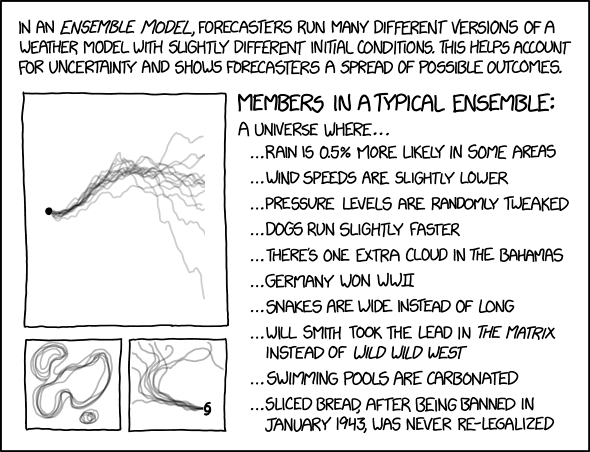
Statistical Sins: Not Making it Fun (A Thinly Veiled Excuse to Post a Bunch of XKCD Cartoons)

For today's post, I've decided to start pulling together XKCD cartoons corresponding to statistics/probability concepts. Why? Because there are some great ones that will liven up your presentation or lecture. Much like the Free Data Science and Statistics Resources post, this is going to be a living document.

Probability


Outliers

Hypothesis Testing

Null


P-Hacking:


Correlation


Randomness


Visualizing Data


Other Concepts


Monday, February 12, 2018

Things I'm Loving Today

What am I loving today? Well..
  • Chris Stuckman's hilarious review of Fifty Shades Freed:
  • And while we're at it, his spot on review of The Cloverfield Paradox (go watch on Netflix first if you want to see it):
  • For comparison, you can also check out the review of The Cloverfield Paradox from my friend over at Is It Any Good?
  • David Robinson of Variance Explained tells us how to win your office Super Bowl square.
  • And finally, this sign I saw on my walk to work this morning:

Sunday, February 11, 2018

Statistics Sunday: My Favorite R Packages

Last year, I shared a post to help you get started with R and R Studio - check it out here. As I install R on yet another computer, it occurred to me that now might be a good time to blog about the R packages I use so often, installing them is usually my first step right after installing R and R Studio.

Whenever you install R, you'll get the base package, which has many built-in statistics, and some additional libraries. Libraries add functionality to R - you install and load a library to have access to its built-in functions. These libraries/packages are written and contributed by users - some by individuals, some organizations or universities, and some collaborations among users and/or organizations. If you navigate over to the Comprehensive R Archive Network (CRAN) website, you'll find that there are currently 12,133 packages available. There are R packages to do just about anything, and often more than one for any particular statistical approach.

You don't need all of them of course, and may not have any need for most of them. And the packages I use for my own work are likely to be very different from the ones you would need. But my goal for today is to show you the R packages that I think are either universally useful for statisticians, or are just so good, I have to share them with others.

  • dplyr - Part of the "tidyverse" of R packages, this package offers a "grammar" of data manipulation, allowing you to easily filter and mutate (the term used for aggregating data or computing a new variable); this package works on data both in and out of memory, so you can even use it on datasets too large to store in your own computer's memory
  • ggplot2 - Another member of the tidyverse, this one using the grammar of graphics (gg); similar syntax is used to create many different kinds of charts and figures, with just a few changes for type, making it much easier to learn and very flexible
  • psych - Described by the creator, William Revelle of Northwestern University, as a "general purpose toolkit for personality, psychometric theory, and experimental psychology," this package is great for running quick descriptives, data reduction, and psychometric analysis (mostly classical test theory); it also has its own website, filled with resources for learning R
  • lavaan - An easy-to-use package for conducting confirmatory factor analysis and structural equation modeling; I had the pleasure of attending a workshop with one of the developers of the package, Yves Rosseel, a couple of years ago
  • semPlot - Is it possible for an R package to change your life? This package is brilliant; you create your measurement or structural equation model as an R object - to analyze with lavaan or whatever package you choose - then use this package to draw that model for you, with just a line or two of code, complete with factor or path loadings if you'd like. No more hunching over Powerpoint creating figures or accepting the messy drawings produced by SEM software.
  • metafor and rmeta - Two R packages for meta-analysis, which I learned to use in a Meta-Analysis with R course I took a year or so ago. Personally I found the metafor package more useful, but both packages are installed on my computer and have different enough strengths that I could definitely justify installing both
  • RPostgreSQL - Last year, I took a course on SQL, which, after teaching us some basics in PostgreSQL, showed us how to bring SQL data into R; if you, like me, know just enough SQL to be dangerous and prefer to use statistical software to analyze your data, this package will let you pull SQL data into R data frame to be analyzed with whatever package(s) you choose
You can install any of these libraries with install.packages("libraryname") and load a package for use with library("libraryname"). While it's completely fine to have multiple libraries loaded at once, remember that some libraries may use the same function name. R will give the most recently loaded library precedence when functions exist in more than one - and it will let you know when you've loaded a library what functions are now masked from the other loaded libraries.

I tend to measure my productivity by how many R packages I installed that day, so I'm always exploring and learning new approaches and installing new packages. Hopefully I'll do another post like this in the future where I blog about new packages I'm loving.

Sound off, readers - what are your favorite R packages?


Monday, February 5, 2018

Afternoon Reading

I'm currently working from home, meaning I'm sitting on my couch, watching the snow falling as I write this. I'll be driving into the city later this afternoon. For now, I'm happy to be in my warm apartment.

Here's what I'm reading this afternoon:

Saturday, January 13, 2018

More Reading Data Analysis - This Time with Friends

Last week, I wrote a blog post in which I analyzed my reading habits from 2017. I had so much fun pulling that data together and playing with it that I took things a step farther: I decided to look at my friends' 2017 reading habits as well.

I included all friends on Goodreads who logged at least one book as read in 2017. This gives me data on how many books (and which ones) were read by friends who use Goodreads to log their reading activity. I did not include friends who logged 0 books, because there’s no way of knowing if they 1) did not read at all in 2017 or 2) did not log books they read or logged books without adding a read date. This resulted in a dataset of 40 friends and a total of 692 books.

Other things I should note about the data:
  • The dataset isn’t as complete as the one I analyzed for myself; this one includes book title, author, page length, and indicators of which reader(s) logged that book. I didn’t include start/read dates, genres, or rating data. (I originally thought about including ratings, but there was surprisingly little overlap among my friends in books read, so that limited analysis options. I may still pull in genre, though.)
  • Goodreads only gave me first author in my data pull. There are definitely books in the dataset that have multiple authors, but for the sake of simplicity, all author analyses were performed on first author only. Once again, I can pull in these data later if they end up being useful.
  • When I looked at page counts for readers, I noticed a few very long books, so I examined these books to make sure they were not box sets logged as single books. Most were simply very long books, but two instances were in fact multiple books; one case was a 5000+ page book that was actually a 22-book eBook compilation. For these two cases, I updated book read counts and page numbers to reflect the number of actual books, resulting in a different number of books read in the dataset than would be displayed for the person on Goodreads. But this was important when I started doing analysis on page lengths – my histograms and box plots were shrunk on one side to make up for extreme outliers that were not actually reflective of real book length.
  • To track individual readers, I used reader initials, which I then converted into a numeric code to protect reader identity. Should anyone express an interest in playing with this dataset, I’d be able to share it with no identifying information included.
  • A few friends logged audiobooks, which have strange page counts. (For instance, a 1.5 hour audiobook came in at 10 pages! 1.5 hours isn't a long book, but it's certainly longer than 10 pages.) If I could find a print copy of the audiobook either on Goodreads or Amazon, I used that page count. But that left 5 books without real page counts. Information I found online suggested audiobooks are approximately 9300 words per hour, and that a printed book has about 300 words per page. So I used the following conversion: (audiobook length in hours * 9300)/300. This is a gross approximation, but since it only affected 5 books out of 692, I’m okay with it.
Findings

The 9 most popular books in my dataset
Number of books read by a single reader in 2017 ranged from 1 to 190, with an average of 18.5 books. But the mean isn’t a good indicator here. As you can see in the plot below, this is a highly skewed distribution. Almost 28% (n=11) of my friends logged 1 book in 2017 (and this is the mode of the distribution); only 10% (n=4) read more than 50 books, and all but 1 person read fewer than 100 books. The median was 7 books.


The barplot is easier to read without this outlier:


For the most part, each reader was unique in the books he or she read: 94.5% (or 654) books were unique to a single reader, and about 4.1% (29 books) were read by 2 readers in the dataset. That left 9 books (1.3%) read by between 3 and 6 people, which I display in the graphic above. As I mentioned in that previous reading post, the most popular book was The Handmaid’s Tale, read by 6 people. The remaining books were A Man Called Ove, 4 people, and each of the following with 3 people: Dark Matter by Blake Crouch, Harry Potter and the Half-Blood Prince and Harry Potter and the Deathly Hollows both by J.K. Rowling, Into the Water by Paula Hawkins (which won Best Mystery & Thriller in the Goodreads Awards), Thirteen Reasons Why by Jay Asher, Turtles All the Way Down by John Green (which ranked #20 in Amazon's Top 100 list), and Wonder by J.C. Palacio.

True, my dataset probably won’t generalize beyond my friend group, but the popular books match up really well with Amazon’s This Year in Books analysis, which showed The Handmaid’s Tale was the most read fiction book.

The second most popular book on Amazon’s list, It, was read by 2 people in my dataset. Oh, and speaking of Stephen King, he was the most popular author in my data, contributing 13 books read by 8 readers.


The second most popular was Neil Gaiman, with 11 books across 5 readers.


And in fact, going back to my previously noted flaw, that I only analyzed first author, both of these popular authors had 1 book with a coauthor. Sleeping Beauties (winner of Best Horror in Goodread's awards), which is included in the Stephen King's graphic above (because he's first author) wrote that book with his son, Owen. And Neil Gaiman should have 1 additional book in his graphic: Good Omens: The Nice and Accurate Prophecies of Agnes Nutter, Witch. That book was cowritten with Terry Pratchett, who was first author and thus the only one who got "credit" for the book in my dataset. The addition of that book would increase Neil's contribution to 12 books, but would have no effect on number of unique readers, or his rank in terms of popularity.

But I should note that these two were most popular based on number of books + number of readers. If I only went off number of books in the dataset, they would just break the top 5. Based on sheer number of books, Erin Hunter was most popular with 22 books and Victoria Thompson was second with 19 books. Lee Child came in third with 14 books.

The cool thing about those particular results? They came from individual readers. One person read those 22 Erin Hunter books, a different person read the 19 Victoria Thompson books, and a third person read the 14 Lee Child books. (In total, these 3 friends read 345, or 49.9%, of the books included in the dataset.) In fact, it was cool to see the fandom of my different Goodreads friends.

I'll present some more work from this dataset tomorrow, for Statistics Sunday, when I'll be demonstrating the boxplot. So stay tuned for more results from this dataset!

Monday, January 1, 2018

2018 Goals

Happy New Year! I had a great New Year's Eve, attending a party with friends, and have been taking it easy today. But I've been thinking about my goals for the year, and wanted to share for accountability purposes.

First off, I want to add one quick update to my 2017 Year in Review - I finished book 53 before heading out to the party last night, making my page count 17194. I'm sure I had many years as a kid where I read more than that, but this is my highest count since I started tracking.

And now for my goals!
  1. Read at least 48 books - this is the same goal I set last year. I commute by train now, and I always have a book with me in case of unexpected downtime, so this seems to be an easy goal for me.
  2. Relatedly, I have a huge stack of to-read books, so I'm making a resolution that I can't buy any books this year. Instead, I need to read all of the books on my to-read shelves (yes, there are multiple). I am allowed to borrow books, from the library or friends, and I can receive books as gifts, but no purchases. I have a feeling this one is going to be very hard.
  3. Write at least 12 short stories - Ray Bradbury recommends writing one per week, but with a full-time job, multiple hobbies, and a social life, that's going to be difficult. I think one per month is a good goal, and I can always exceed it if I'm feeling particularly inspired.
  4. Make sure I always post my weekly statistics posts: Statistics Sunday and Statistical Sins. For that reason, I'm not going to make the goal of writing 1 post per day. I'm happy with 3-4 posts per week, and once again, I can exceed that if I'm feeling particularly inspired.
  5. Build up more of an online presence for Deeply Trivial, including Twitter and Facebook. I just need to finish something up first - stay tuned!
  6. Visit a new state - I've visited 35 of them, so I want to bring that total to 36 by the end of 2018! Most of the states I have left are on the East Coast or Northern Midwest, so I have some easy ones I can hit on a road trip. But who knows? Maybe I'll spoil myself with a trip to Hawaii this year instead.
  7. I always make a goal to eat healthier and get in better shape, but I plan on really putting some effort into it this year. (My weight has been creeping up and I'm not happy about it.) I already go to a dance class once a week, so I think I can add a goal of getting a workout in 1-2 more times per week.
  8. Finish my book! I've been working on the book I wrote for 2016 NaNoWriMo - I still have one subplot to wrap up, and a few more scenes to write.
You'll notice I'm calling them goals rather than resolutions (well, except #2). I've blogged previously about the problem with resolutions. I called them resolutions last year, but after putting more thought into the idea recently, I think goals is more true to my approach to making New Year's resolutions. But if you insist...

Sunday, December 31, 2017

Year in Review: 2017

I'm looking back over 2017, and pulling together some metrics to answer the question posed by Rent: How do you measure a year? Here are a few ways:

Books read: 52 (for a total of 16,906 pages)
Blog posts written: 365 (counting this one)
Jobs: 2, and fortunately, less than 2 months of unemployment
Concerts Performed: 7, plus a very successful benefit for my choir
Movies Seen in Theatre: 14
Plus another NaNoWriMo win!

I also decided to check out my 5 most popular blog posts from the year, based on page views, and all of them are about statistics (go figure):
  1. Statistical Sins: Stepwise Regression
  2. Statistics Sunday: What Are Degrees of Freedom? (Part 1)
  3. Statistics Sunday: Free Data Science and Statistics Resources
  4. Statistics Sunday: What is Bootstrapping?
  5. Statistical Sins: Know Your Variables (A Confession)
I've already shared some of my writing goals for 2018. I'm putting together some additional goals and resolutions for 2018, and I'll share those soon!

Sound off, readers - how do you measure your year? And what are your goals for 2018? Feel free to describe in the comments or share a link to your own blog posts on the subject.

By the way, you might also enjoy Google's Year in Search 2017, which gives some of the highlights for the year:

Wednesday, December 27, 2017

Trivial Only Post: Reasons I Don't Like Knitting in Public

I'm working on a knitted gift for a handmade gift exchange I'm going to tomorrow night. As I scramble to finish, I find myself needing alone time to knit. Why? Because I've realized I hate knitting in public, and here's why:
  1. Random strangers trying to start conversations with me while I knit:
    • "What are you making?" The least obnoxious of random comments, but still frustrating if I'm trying to concentrate
    • Comments about my age, e.g., I'm too young to be a knitter
    • "Have you ever made a ________?" Which results in a request for me to list out all the things I've made
    • "Are you on Etsy?" Aw, you're sweet, but I'm a slow knitter, and have to have a pattern to make anything. I'm fast and able to improvise with crochet, but not knitting
    • "That seems really hard. I bet you couldn't teach me how to do it." You're right, I couldn't teach you, because I don't know you.
  2. There's a surprising amount of swearing coming out of my mouth when I knit - basically every time I struggle to add a stitch, reduce a stitch, drop a stitch, or otherwise screwed up from poor counting

Friday, December 22, 2017

Travel Day Links

I finally saw The Last Jedi last night and loved it. I'll try to have more reactions soon. For now, I'll say I loved and I'm so happy to no longer have to dodge spoilers.

I'm heading out of town for the holidays later on this morning/afternoon. I have a few articles up to read:


Happy holidays, everyone! I'm driving into cold temperatures and lots of snow, so I'm packing a ton of books and my laptop (and lots of sweaters and yoga pants), and planning to spend much of my time reading and writing. 

Thursday, December 7, 2017

Today's Links

I've got a long day ahead of me today, including a conference call this evening until around 7:30. But here are the links I have sitting open that I'll read/watch/do later:


Wednesday, December 6, 2017

Winning Books on Goodreads

Goodreads just announced their winners of Best Books 2017:
There is surprisingly little overlap between this list and Amazon's Top 100. You might remember I lamented that Amazon didn't include The Radium Girls, which won History & Biography here, or What It Means When a Man Falls From the Sky, which was nominated for Best Fiction here, but did not win. In fact, the only books from this list that made Amazon's list were Little Fires Everywhere (2), The Sun and Her Flowers (60), and The Hate U Give (21).

I've added many of these books to my reading list. In fact, The Radium Girls has been sitting on my to-read shelf for months now, and I keep picking up Sleeping Beauties in the bookstore, only to put it back down and tell myself not to buy it until I'm ready to read it. 

I may have a book problem, but I'm kind of okay with it...

Friday, December 1, 2017

Link Round-Up

Happy Friday, everyone! Here are the tabs I have open, that I've either read or will be reading soon:
  • The closest The Room will ever get to winning an Oscar - the "making of" comedy, The Disaster Artist starring James Franco is getting some Oscar buzz
  • Matt Lauer has commented on the sexual harassment allegations - my favorite part is where he says, "Repairing the damage will take a lot of time and soul searching and I'm committed to beginning that effort. It is now my full time job." Translation: Look how hard I'm working to make it right. And, oh yeah, I'm reminding you that I no longer have a full-time job. Pardon me while I make the "nobody cares" motion. You guys know the one I'm talking about.
  • Speaking of men behaving badly, a friend shared this older article that details the history of Chevy Chase pissing people off, and apparently being racist and sexist. He's Chevy Chase, and I'm not. And for that, I'm thankful.
  • Finally, the APS Observer publishes an article about the hidden costs of sleep deprivation
Also: If you've never experienced The Room and don't really want to watch the entire horrible movie, you can check out Chris Stuckmann's detailed review to get pretty much everything you need to appreciate The Disaster Artist:

Monday, November 27, 2017

Statistics Sunday: Data Discovery

For today's (late) Statistics Sunday post, I was going to dig into FiveThirtyEight's Thanksgiving data, to find the real reason people in the West eat so much salad at Thanksgiving. As I was inspecting the data and readme file, I clicked back in the directory and found that FiveThirtyEight has shared a ton of data on GitHub. So instead of analyzing Thanksgiving data, I clicked through readme files of other data they had available.

Yes, I became distracted by new data.


Some favorites among the list:

Wednesday, November 15, 2017

NaNoWriMo Hump-Day: Some Resources for Day 15 (And Beyond)

We're reaching the midpoint of NaNoWriMo - and on a Wednesday, so today is like a Super Hump-Day. By the end of today, I plan to have at least 25,000 words written if it kills me. So if you too need help to get through the humpiest of all hump-days, here are some resources:

  • When your writing is just too "very," this list gives you replacements for "very + [adjective]"
  • Speaking of the middle of things, here's some advice on giving some love to the middle child of your novel, the middle act
  • Jeff Goins says the way to be a good writer is practice, practice
  • Daily Writing Tips pens a list: 40 shades of -ade
  • And if you're feeling self-doubt about how you could possibly write a novel [raises hand], know you're in good company

Tuesday, November 7, 2017

Link Roundup

As I continue working on our content validation study, I have a bunch of links open that I'll read as a reward for finishing my next big task:
  • So good it really is illegal: Apparently Samuel Adams released a beer that costs $199 and is 28% ABV, making it illegal in 12 states. The beer, called Utopias (hmmm, wonder why?), is a mixture of various batches, some of which have been aged 24 years. The aging process is done in a variety of wooden barrels, including barrels for Bourbon, White Carcavelos, Ruby Port, Aquavit, and Moscat. The recommended serving size is 1 ounce.
  • Janelle Shane over at AIWeirdness (who gave us neural network paint names) is celebrating NaNoWriMo by using a neural network to generate some first lines for a potential novel. The results ranged from bizarre nonsense to strange poetry. Also, she's asking readers to share first lines, including their own first lines from novels they've written/are writing. Contribute using this form. I hit a bit of a wall in my own novel, and barely wrote this weekend. So on my train ride this morning, I started working on the outline I said I wasn't going to make. While I'd love to follow Stephen King's writing advice exactly, I'm just too much of a plantser.
  • Today's Google Doodle honors Pad Thai. And now I'm craving noodles.