We were working on a large language survey, involving 8 tests, one of which was new. This is an individually-administered battery of tests, meaning a trained individual gives the test one-on-one to the examinee. Questions are read aloud and the examinee responds either verbally or in writing. Each test only has one set of questions, and is adaptive: the set of questions the examinee receives depends on their pattern of correct answers. If they get the first few questions right, they go on to harder questions, but if they get the first few wrong, they go back in the book to easier questions. The test ends when the examinee gets a certain number incorrect in a row or reaches the end of the book (whichever comes first).
When giving the test, the administrator won't always start at the beginning of the book. Those are the easiest questions, reserved for the youngest/lowest ability test-takers. Each test has recommended starting places, usually based on age, but the administrator is encouraged to use his or her knowledge of the examinee (these tests are often administered by school psychologists, who may have some idea of the examinee's ability) to determine a starting point.
We had one brand new test and needed to generate starting points, since we couldn't use starting points from a previous revision of the battery. We decided, since this new test was strongly related to another test, to generate recommended starting points based on their raw score on this other test. We knew we would need a regression-based technique, but otherwise, I was given complete control over this set of analyses.
After generating some scatterplots, I found the data followed a pretty standard growth curve, specifically a logistic growth curve:
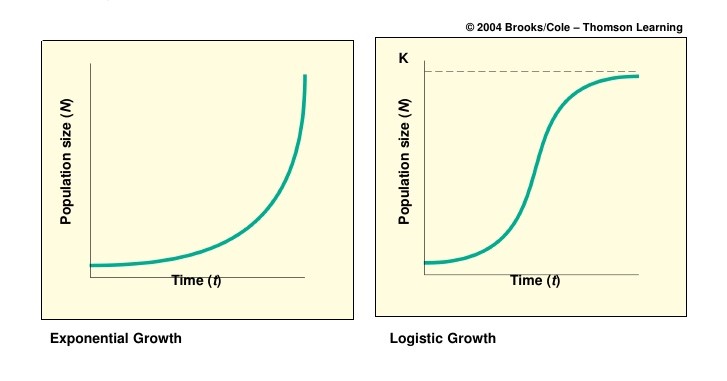
So standard linear regression would not work, because of the curve. We would deal with this in regression by adding additional terms (squared, cubed, and so on) to address the curve.
But the data violated another assumption of regression, even polynomial regression: the variance was not equal (or even approximately equal) across the curve. There was substantially more variation in some parts of the curve than others. In statistical terms, we call this heteroscedasticity. I did some research and found a solution: quantile regression. It's a really cool technique that is pretty easy to pick up if you can understand regression. Essentially, quantile regression allows for different starting points (constants) and slopes depending on the percentile of the individual data point. You can set those percentiles at whatever value you would like. And quantile regression makes no assumptions about heteroscdasticity. I read some articles, learned how to do the analysis in R (using the quantreg package), and away I went.
I was so proud of myself.
We decided to use raw score instead of scale score for the starting points. These tests were developed with the Rasch measurement model, but the test administrator would only get approximate scale score from the tables in the book. Final scores, which are conversions of Rasch logits, are generated by a scoring program used after administering all tests. Since the administrator is obtaining raw scores as he or she goes (you have to know right away if a person responded correctly to determine what question to ask next), this would be readily available and most logical to administrators. I had my Winsteps output, which gave person ID, raw score, Rasch ability, and some other indicators (like standard error of measurement), for each person in our pilot sample. So I imported those outputs from the two tests, matched on ID, and ran my analysis.
I stress once again: I used the Winsteps person output to obtain my raw scores.
My data were a mess. There seemed to be no relationship between scores on the two tests. I went back a step, generating frequencies and correlations. I presented the results to the team and we talked about how this could have happened. Was there something wrong with the test? With the sample? Were we working with the wrong data?
I don't know who figured it out first, but it was not me. Someone asked, "Where did the raw scores come from?" And it hit me.
Winsteps generates raw scores based on the number of items a person answered correctly. Only the questions answered and no others. But for adaptive tests, we don't administer all questions. We only administer the set needed to determine a person's ability. We don't give them easy questions because they don't tell us much about ability. We know the person will get most, if not all, easy questions correct. So when the administrator generates raw scores, he or she adds in points for the easy questions not administered. Winsteps doesn't do that. It simply counts and adds.
There was no relationship between the two variables because I wasn't using the correct raw score variable. I had a column called raw score and just went on autopilot.
So I had a couple days of feeling super proud of myself for figuring out quantile regression... and at least that long feeling like an idiot for running the analysis without really digging into my data. The lack of relationship between the two tests should have been a dead giveaway that there was something wrong with my data. And problems with data are often caused by human error.
No comments:
Post a Comment