Thursday, August 31, 2017

Climate Change and the Behavior of a Storm

Hurricane Harvey has been more devastating than most of us expected. As I stopped to grab breakfast on my way to work this morning, I saw an infographic on the front page of USA Today detailing just how bad things are in Texas in terms of the cost of the damage (to say nothing of the loss of human life):


Part of the reason Harvey has been so devastating is because its behavior has been different from many previous hurricanes, and climate change may be to blame:
In the case of Harvey, which is dumping rivers of rain in and around Houston and threatening millions of people with catastrophic flooding (see photos), at least three troubling factors converged. The storm intensified rapidly, it has stalled out over one area, and it is expected to continue dumping record rains for days and days.

Hurricanes tend to weaken as they approach land because they are losing access to the hot, wet ocean air that gives the storms their energy. Harvey's wind speeds, on the other hand, intensified by about 45 miles per hour in the last 24 hours before landfall, according to National Hurricane Center data.

[Kerry Emanuel, an atmospheric sciences professor at the Massachusetts Institute of Technology,] analyzed the evolution of 6,000 simulated storms, comparing how they evolved under historical conditions of the 20th century, with how they could evolve at the end of the 21st century if greenhouse gas emissions keep rising. The result: A storm that increases its intensity by 60 knots in the 24 hours before landfall may have been likely to occur once a century in the 1900s. By late in this century, they could come every five to 10 years.
As the article points out, the big reason for all the damage is the amount of rainfall, resulting in flooding. That too is likely due to climate change. In fact:
Every scientist contacted by National Geographic was in agreement that the volume of rain from Harvey was almost certainly driven up by temperature increases from human carbon-dioxide emissions.
This is of course exacerbated by the fact that Harvey has stalled over land. Most hurricanes break apart or move off. Interestingly enough, the article notes that most climate scientists don't think this particular stall can be attributed to climate change, just bad luck; more research is needed, though, because some say climate change could result in changes in pressure fronts, which would impact how long a storm stalls in one place.

Wednesday, August 30, 2017

Statistical Sins in History: Handling and Understanding Criticism

Today's Statistical Sins will be a little bit different, using an example from history of statistics to talk about an aspect of research publication. I'm currently reading Fisher, Neyman, and the Creation of Classical Statistics by Erich L. Lehmann. I've talked before about Egon Pearson, who was Jerzy Neyman's long-time collaborator. The feud between Neyman and Ronald Fisher is legendary in statistical history, as is the feud between Karl Pearson and Fisher. But not as much attention has been given to the feud between E. Pearson and Fisher. The start of that feud - though arguably mostly caused by Fisher and K. Pearson's ongoing competition of who could be more petty - can probably be traced to a review, authored by E. Pearson, about Fisher's book, Statistical Methods for Research Workers.

The title page from the first edition
The review in question was regarding Fisher's second edition of the book. It was positive overall, except for this (note: this is quoted from Fisher, Neyman, and the Creation of Classical Statistics; I didn't track down the original):
There is one criticism, however, which must be made from the statistical point of view. A large number of the tests developed are based... on the assumption that the population sampled is of the "normal" form. That this is the case may be gathered from a careful reading of the text, but the point is not sufficiently emphasized. It does not appear reasonable to lay stress on the "exactness" of the tests when no means whatever are given of appreciating how rapidly they become inexact as the population sampled diverges from normality... [N]o clear indication of the need for caution in their application is given.
The issues E. Pearson is addressing here are 1) the robustness of a test and 2) determining how far a dataset needs to diverge from normal before it no longer satisfies the requirements of the test. These are legitimate questions, and further, there is a very good reason E. Pearson raised them. But first, the fallout.

Fisher was pissed. He was so pissed he wrote a response to the journal that originally published the review (Nature). We don't know exactly what this letter said, but based on later correspondence, it appears Fisher believed the question of normality was irrelevant to the content of the book (and I'm sure there was some name-calling as well). As often occurs with a letter to the editor regarding a published paper, the editor sent it to E. Pearson and asked if he would like to respond. He wrote his response but before sending it off, showed it to William Sealy Gosset.

Gosset, who had a good working relationship with Fisher, decided to serve as mediator, and wrote a letter to Fisher to try to settle the dispute. Apparently that approach worked, because Fisher decided to withdraw his letter to Nature (which is why we don't know what it said) and suggested Gosset should instead write a letter (on Fisher's behalf) responding to E. Pearson's review. Of course, Fisher did end up writing a response... to Gosset's letter, because Gosset agreed with E. Pearson's comment about normality, saying that, though he believed the Student distribution (which he created) could withstand "small departures from normality," we needed more research into this topic, and in the meantime, experts in statistical distributions (like Fisher) could help guide us on how to respond when our data aren't normal. Gosset knew Fisher was a better mathematician, and likely saw this as a way of asking Fisher for help in answering these questions.

Fisher, instead, brought up the possibility of distribution-free tests.

The thing Fisher never really considered is why E. Pearson was so fixated on this issue of robustness and normality. Do you know what are two of E. Pearson's contributions to the field of statistics? Exploration into determining the best goodness of fit test (that is, the best way to determine if a set of data matches a theoretical distribution, like the normal distribution - part of his collaboration with Neyman) and the concept of robustness. In fact, he was already working on much of this when he wrote that review in 1929.

E. Pearson was not trying to make Fisher look bad or call him dumb. On the contrary: E. Pearson was trying to connect what he was working on to Fisher's work and set the stage for his own contributions. In fact, this is often the reason researchers will criticize another researcher's work in a paper or letter to the editor: they're setting the stage for the contribution they're about to make. They're taking the opportunity to say "we need X," only to turn around and deliver X soon after.

This is done all the time. People even do it in their own papers, when they highlight a certain shortcoming of their research in the discussion section; they're probably highlighting a flaw that they've already figured out how to fix and may already be testing in a new study. (Or they added it to make a reviewer happy.)

Fisher's response was because he couldn't see the reason E. Pearson was criticizing him. He just saw the criticism and went into rage mode. It's easy to do. Hearing criticism sucks. And while, as researchers we frequently have to deal with criticism of our work in dissertation defenses and peer reviews, they are rarely so public as they are with a published book review or letter to the editor.

I'll admit, when I received an email from a journal that someone had written a letter to the editor in response to one of my articles (and asking if I'd like to write a response), I made that sound kids make when they have a skinned knee:


It took some courage to open the file and read the letter. I was amazed to see it was incredibly positive. I can only imagine what my reaction would be if it hadn't been positive.


But if we can take a step back and realize why this researcher might be waging a particular criticism, it might make it a bit easier to handle the hurt feelings. Who knows how different things would have been for the field of statistics if - instead of throwing a tantrum and writing a pissed off letter to the editor - Fisher had written E. Pearson a letter directly saying, "I think this issue of normality is irrelevant to what I was trying to do. Why do you think it's important?" Maybe we would be talking today about the amazing collaboration between E. Pearson and Fisher. (Probably not, but a girl can dream, right?)

Tuesday, August 29, 2017

The Unpopularity of Presidential Pardons

Following up on yesterday's post about the Arpaio pardon, here's an article from FiveThirtyEight examining Presidential pardons over the year, highlighting not only the unpopularity of these pardons, but what makes Trump's pardon of Arpaio so unconventional:
Several political allies and foes immediately condemned the move as inappropriate and an insult to the justice system. But most of the criticized characteristics of Arpaio’s pardon have at least some parallels to previous ones.

The number of controversial characteristics of the Arpaio pardon, however, is unusual and raises questions about the political fallout that Trump will face. The Arpaio pardon, in other words, does have historical precedents (as Trump said on Monday) — just not good ones.
“A pardon is a judgment call that the president makes, and we get to police that through the political process,” [Michigan State University law professor Brian] Kalt said. Noah Feldman, a professor at Harvard Law School, said that the fact that Arpaio was convicted for deliberately ignoring a court’s order to stop violating individuals’ constitutional rights places him in a category of his own. The only recourse for such a dramatic abuse of presidential power, according to Feldman, is impeachment. Or, short of impeachment, Kalt pointed to Ford’s pardon of Nixon: “Ford decided it was the right thing to do, and he lost the election as a result.”

Social Learning and Amazon Reviews

In my inbox this morning was a new article from Psychological Science exploring how people use statistical and social information. And a great way to examine that is through Amazon reviews.

Social learning - also called vicarious learning - is when we learn by watching others. One of the famous social learning studies, Bandura's "bobo doll" study found that kids could learn vicariously by watching a recording, showing us that it isn't necessary for the learner to be in the same room as the model. The internet has exponentially increased our access to social information. But Amazon reviews not only provide social information, but numerical information:
One can learn in detail about the outcomes of others’ decisions by reading their reviews and can also learn more generally from average scores. However, making use of this information demands additional skills: notably, the ability to make intuitive statistical inferences from summary data, such as average review scores, and to integrate summary data with prior knowledge about the distribution of review scores across products.
To generate material for their studies, they examined data from 15 million Amazon reviews (15,655,439 reviews of 356,619 products, each with at least 5 reviews, to be exact). They don't provide a lot of detail in the article, instead referring to other sources, one of which is available here, to describe how these data were collected and analyzed. (tl;dr is that they used data mining and machine learning.)

For experiment 1, people had to make 33 forced choices between two products, which were presented along with an average rating and number of reviews. Overall, the most reviewed product had 150 reviews and the least reviewed product had 25, with options fall between those two extremes. An example was shown in the article:


They found that people tended to prefer the product with more reviews more frequently than their statistical model (which factored in both number of reviews and rating) predicted. In short, they were drawn more to the large numbers than to the information the ratings were communicating.

Experiment 2 replicated the first experiment, except this time, they had participants make 25 forced choices, and decreased the spread of number of reviews: the minimum was 6 and the maximum was 26. Once again, people were drawn more to the number of reviews than the ratings. When they pooled results from the two experiments and examined them using meta-analysis techniques, they found that people unaffected by the drastic differences in number of reviews between experiment 1 and experiment 2. As the authors state in their discussion:
In many conditions, participants actually expressed a reliable preference for more-reviewed products even when the larger sample of reviews served to statistically confirm that a poorly rated product was indeed poor.
Obviously, crowd-sourcing information is a good thing, because, as we understand from the law of large numbers, data from a larger sample is expected to more closely reflect the true population value.

The problem is that people fixate on the amount of information and use that heuristic to guide their decision, rather than using what the information is telling them about quality. And there's a point of diminishing returns on sample size and amount of information. A statistic derived from 50 people is likely closer to the true population than a statistic derived from 5 people. But doubling your sample from 50 to 100 doesn't double the accuracy. There comes a point where more is not necessarily better, just, well, more. This is a more complex side of statistical inference, one the average layperson doesn't really get into.

And while we're on the subject of Amazon reviews, there's this hilarious trend where people write joke reviews on Amazon. You can read some of them here.

Monday, August 28, 2017

Arpaio and Shifting Survey Responses

On Friday, the President issued a pardon for former Maricopa County Sheriff Joe Arpaio. Since that announcement, stories about Arpaio and his history have filled my Facebook newsfeed. Perry Bacon, Jr., at FiveThirtyEight argues that this pardon is motivated by conservative identity politics. In his article, he links to a YouGov poll, citing that - as evidence of his arguments about conservative identity politics - opinions about the pardon fall along party lines. But there's something even more interesting in this YouGov poll: an exploration of framing and its impact on opinions:
On Thursday and Friday, before President Trump pardoned former Maricopa county Sheriff Joe Arpaio, YouGov polled 1,000 Americans about what they thought should be done. Before supplying any information about the details of the Arpaio case, 24% said they were in favor of a pardon and 37% were opposed.

However, this is the type of question where opinion can change quickly as the public learns more about the issue. Despite widespread media coverage and Trump's hint of a pardon on Tuesday, a majority of the public said they knew "little" or "nothing at all" about the Arpaio case. To see what might happen if people were exposed to arguments for and against the pardon--as will inevitably happen--we asked our sample whether they agreed or disagreed with pro and con arguments.

The pro-pardon wording was based on White House talking points. The anti-pardon statement mirrored language used by Arpaio’s opponents.
After hearing one of the two arguments, respondents were then exposed to the other, so that by the end of the poll, everyone had heard both sides. This is when the most pronounced party differences in opinion appeared:


Specifically, most of the movement was among respondents who had selected "Not Sure" in their initial opinion. Among Democrats and, to a lesser extent, Independents, these individuals moved to "Oppose." The opposite trend is observed among Republicans, though some people who were initially "Oppose" also appear to have moved to different columns.

This presents a problem with regard to surveying about these issues. When addressing issues that are not well known, or where limited facts are available, it makes sense to include some background in opinion polling. But this highlights an important methodological issue - the way an issue is framed will certainly have an impact on responses (we've known this for a while), but including the "whole story" with two sides of an argument could also impact opinions, by leading to a group polarization effect. Notice what pushed many respondents to the poles of the continuum (a continuum with Oppose on one end and Favor on the other) was not that this was an issue addressed by current administration - which is in itself very divisive - but instead was the use of a partisan issue (illegal immigration) in the background information.

As more and more issues are politicized, we're likely to see more and more of this group polarization effect. And that will make it even harder to find a common ground.

Sunday, August 27, 2017

Statistics Sunday: Dealing with Missing Data

For my dissertation, participants read and completed a large packet. It included a voir dire questionnaire, abbreviated trial transcript, and post-trial questionnaire. Because I didn't have a grant or really any kind of externally contributed budget for the project, I copied and assembled the packets myself. To save paper (and money), I copied the materials two-sided. I put page numbers on the materials so that participants would (hopefully) notice the materials were front and back.

Sadly, not everyone did.

When I noticed after one of my sessions that people were not completing the back of the questionnaire, I added in arrows on the first page, to let them know there was material on the back. After that, the number of people skipping pages decreased, but still, some people would miss the back side of the pages.

Sometimes, despite your best efforts, you end up with missing data. Fortunately, there are things you can do about it.


What you can do about missing data depends in part on what kind of missingness we're talking about. There are three types of missing data:

Missing Completely at Random

In this case, missing information is not related to any other variables. It's rare to have this type of missing data - and that's actually okay, because there's not a lot you can do in this situation. Not only do you have missing data, there's no relationship between the data that is missing and the data that is not missing, meaning you can't use what data you have to fill in missing values. But you're also statistically justified in proceeding with what data you have. Your complete data is, in a sense, a random sample of all data from your group (which includes those missing values you didn't get to measure).

Missing at Random

‘Missing at random’ occurs when the missing information is related to observed variables. My dissertation data would fall in this category - at least, on the full pages that were skipped. This is because people were skipping those questions by accident, but since those questions were part of a questionnaire on a specific topic, the items are correlated with each other.

This means that I could use my complete data to fill in missing values. There are many methods for filling in missing values in this situation, though it should be kept in mind that any imputation method will artificially decrease variability. You want to use this approach sparingly. I shouldn't use it to fill in entire pages worth of questions, but could use it if a really important question or two was skipped. (By luck alone, all of the questions I had planned to include in analyses were on the front sides, and were as a result very rarely skipped.)

Missing Not at Random

The final situation occurs when the missing information is related to the missing values themselves or to another, unobserved variable. This is when people skip questions because they don't want to share their answer.

This is why I specified above that my data is only missing at random for those full pages. In those cases, people skipped the questions because they didn't realize they were there. But if I had a skipped question here and there (and I had a few), it could be because people didn't see it OR it could be because they don't want to share their answer. Without any data to justify one or the other, I have to assume it's the latter - if I'm being conservative, that is; lots of researchers with no data to justify it will assume data is missing at random and analyze away.

If I ask you about something very personal or controversial (or even illegal), you might skip that question. The people who do respond are generally the people with nothing to hide. They're going to be qualitatively different from people who don't want to share their answer. Methods to replace missing values will not be very accurate in this situation. The only thing you can do here is to try to prevent missing data from the beginning, such as with language in the consent document about how participants' data will be protected. If you can make the study completely anonymous (so that you don't even know who participated) that would be best. When that's not possible, you need strong assurances of confidentiality.

How Do You Solve a Problem Like Missing Data?

First off, you can solve your missing data problems with imputation methods. Some are better than others, but I generally don't recommend these approaches because, as I said above, they artificially decrease variance. The simplest imputation method is mean replacement - you replace each missing value with the mean derived from non-missing values on that variable. This is based on the idea that "the expected value is the mean"; in fact, it's the most literal interpretation of that aspect of statistical inference. 

Another method, which is a more nuanced interpretation of "the expected value is the mean" is to use linear regression to predict scores on the variable with missingness using one or more variables with more complete data. So you conduct the analysis with people who have complete data, then use the regression equation you derived from those participants to predict what the score will be for someone with incomplete data. But regression is still built on means - it's just a more complex combination of means. Regression coefficients are simply the effect of one variable on another averaged across all participants. And outcomes are simply the mean of the y variable for people with a specific combination of scores on the x variables. Fortunately, in this case, you aren't using a one-size-fits-all approach, and you're introducing some variability into your imputed scores. But you're still artificially controlling your variance by, in a sense, creating a copy of another participant.

Of course, you're better off using an analysis approach that can handle missing data. Some analyses can be set up to remove people with missing data "pairwise." This means that for a portion of analysis using two variables, the program uses anyone with complete data on those two variables. People are not removed completely if they have missing data; they're just only included in the parts of the analysis for which they have complete data and dropped from parts of the analysis where they don't. This will work for simpler analyses like correlations - it just means that your correlation matrix will be based on a varying number of people, depending on which specific pair of variables you're referring to.

More complex, iterative analyses can also handle some missing data, by changing which estimation method it uses. (This is a more advanced concept, but I'm planning on writing about some of the estimation methods in the future - stay tuned!) Structural equation modeling analyses, for instance, can handle missing data, as long as the proportion of missing data in the dataset doesn't get too high.

And if you can use psychometric techniques with your data - that is, if your data examines measures of a latent variable - you're in luck, because my favorite psychometric technique, Rasch, can handle missing data beautifully. (To be fair, item response theory models can as well.) In fact, the assumption in many applications of the Rasch model is that you're going to have missing data, because it's often used on adaptive tests - adaptive meaning people are going to respond to different combinations of questions depending on their ability. 

I have a series of posts planned on Rasch, so I'll revisit this idea about missing data and adaptive tests later on. And I'm working on an article on how to determine if Rasch is right for you. The journal I'm shooting for is (I believe) open access, but I'm happy to share the article, even in draft form, to anyone who wants it. Just leave a comment below and I'll follow-up with you on how to share it.

Friday, August 25, 2017

Statistical Sins Late Edition: Three Things We Love

The eclipse was amazing, but after missing 2 days of work this week, playing catch-up Wednesday, and attending an all-day meeting yesterday, I was unable to get myself together and write a Statistical Sins post for Wednesday (or even yesterday). (I did, however, get around to posting a Great Minds in Statistics post on the amazing F.N. David. I've had that post scheduled for a while now.)

I'll admit, part of the problem, that was compounded by lack of time, was not knowing what to write about. But a story that is making the rounds again and made it's way into my news feed is a study from the New England Journal of Medicine regarding a country's overall chocolate consumption and its number of Nobel Prize laureates.


Apparently the correlation is a highly significant 0.791. While the authors get that this doesn't imply a causal relationship, they sort of miss the boat here:
Of course, a correlation between X and Y does not prove causation but indicates that either X influences Y, Y influences X, or X and Y are influenced by a common underlying mechanism.
So that's three possibilities: A causes B, B causes A, or C causes A and B, or what is known as the third variable problem. But they miss the fourth possibility: A and B are two random variables that by chance alone have a significant relationship. There might not be a meaningful C variable.

To clarify, when I say "random variable," I mean a variable that is allowed to vary naturally - we're not actively introducing any interventions to increase the number of Nobel laureates in any country (which in light of this study would probably involve airlifting chocolate in). And when we allow variables to vary naturally, we'll sometimes find relationships between them. That could occur just by chance. In my correlation post linked above, I generated 20 random samples of 30 pairs of variables, and found 3 significant correlations (all close to r = 0.4) by chance alone.

Sure, this is a significant relationship - a highly significant one at that - but there isn't some level of significance where a relationship suddenly goes from being potentially due to chance alone to being absolutely systematic or real. To argue that a relationship of 0.7 can't be due to chance makes no more sense than saying a relationship of 0.1 can't be due to chance. There's a chance I could create two random variables and have them correlate at 1.0, a perfect relationship. It's a small chance, but the chance is never 0. There's no magic cutoff value where we throw out the possibility of Type I error. And the p-value generated by an analysis is not the chance that a result is spurious; it's the chance we would find a relationship of that size by chance alone given what we know about the potential distribution of the variables interest - and what we know about the distribution comes from the very sample data we're speculating about. It's possible the distributions look completely different from what we expect, making the probability of Type I error higher than we realize. (In fact, see this post on Bayes theorem about how the false positive rate is likely much higher than alpha.)

It occurs to me that there are three consumables that people love so much, they keep looking for data that will justify our love of them. Those three things are coffee, chocolate, and bacon.

And the greatest of these is bacon.

It's true though. When we're not publishing stories about how chocolate or coffee benefits your health, we're attempting to disprove those evil scientists who try to convince us bacon is harmful.

Loving these things likely motivates us to study them. And sometimes that involves looking for a relationship - any relationship - with a positive outcome. Observational studies can very easily uncover spurious relationships. Increasing the distance (e.g., looking at country level data) between the effect (e.g., consumption of chocolate) and the outcome (e.g., Nobel prize) can drastically increase the probability that we find a false positive.

I bet you can find many significant relationships - even highly significant relationships - when looking at two variables from the altitude of country-level data. More complicated relationships get washed out when viewing the relationship so far away from individual-level data. In fact, when we remove variance - either by aggregating data across many people (as occurs in country-level data) or by recoding continuous variables into dichotomies - we may miss confounds or other variables that provide a much better explanation of the findings. We miss the signs that we're barking up the wrong tree.

Wednesday, August 23, 2017

Great Minds in Statistics: F.N. David versus the Patriarchy

Happy 108th birthday to Florence Nightingale David! F.N. David, as she is often known, was a British statistician, combinatorialist, author, and general mathematical bad ass who regularly took on the patriarchy's "This is a man's world" nonsense.


She was named after family friend - and self-taught statistician - Florence Nightingale. She took to math at a very early age and wanted to become an actuary. After completing her degree in mathematics in 1931, she applied for a career fellowship at an insurance firm, but was turned down. When she inquired why she was told that, despite being the most qualified candidate, she was a woman and they only hired men. In fact, she was told by many people who turned her down for a job that they didn't have any bathroom facilities for women and that was used as a reason they couldn't hire her.

But in 1933, she was offered a job and a scholarship at University College in London, where she would study with Karl Pearson. In fact, the way she got this opportunity is pretty awesome:
I was passing University College and I crashed my way in to see Karl Pearson. Somebody had told me about him, that he had done some actuarial work. I suppose it was just luck I happened to be there. Curious how fate takes one, you know. We hit it off rather well, and he was kind to me. Incidentally, he's the only person I've ever been afraid of all my life. He was terrifying, but he was very kind. He asked me what I'd done and I told him. And he asked me if I had any scholarship and I said yes, I had. He said, "You'd better come here and I'll get your scholarship renewed," which he did.
She worked for Pearson as a computer - literally. Her job was to generate the tables to go along with his correlation coefficient, a job that involved conducting complicated (and repetitive) analyses using a Brunsviga hand-crank mechanical calculator:


In her interview, linked above, she estimates she pulled that crank 2 million times.

Because she found Pearson - or the "old man" as she referred to him - terrifying, she was incapable of telling him no:
On one occasion he was going home and I was going home, and he said to me, "Oh you might have a look at the elliptic integral tonight, we shall want it tomorrow." And I hadn't the nerve to tell him that I was going off with a boyfriend to the Chelsea Arts Ball. So I went to the Arts Ball and came home at 4-5 in the morning, had a bath, went to University and then had it ready when he came in at 9. One's silly when one's young.
He also would apparently become very upset if she jammed the Brunsviga, so she often wouldn't tell him it was jammed, instead unjamming it herself with a long pair of knitting needles.

After K. Pearson retired, she worked with Jerzy Neyman (who you can find out more about in my post on Egon Pearson, but look for a post on Neyman in the future!), who encouraged her to submit her 4 most recent publications as her PhD dissertation. She was awarded her doctorate in 1938.

During World War II, she assisted with the war effort as experimental officer and senior statistician for the Research and Experiments Department. She served as a member on multiple advisory councils and committees, and was scientific adviser on mines for the Military Experimental Establishment. She created statistical models to predict the consequences of bombings, which provided valuable information on directing resources, and kept vital services going even as London was experiencing bombings. She later said that the war gave women an opportunity to contribute and believes the conditions for women improved because of it.

She returned to University College in London after the war, first as a lecturer, then as a professor. Of course, that didn't change the fact that she was not allowed to join the school's scientific society because it only accepted men. So, she founded a scientific society of her own, that would accept both men and women. They invited many young scientists and apparently irked the "old rednecks" as a result.

In the 1960s, she wrote a book on the history of probability, Games, Gods, and Gambling - I just ordered a copy this morning, so stay tuned for a review! In the late 1960s, she moved to California, where she became a Professor and - shortly thereafter - Chair in the Department of Statistics at the University of California Riverside.

She passed away in 1993.

In 2001, the Committee of Presidents of Statistical Societies and Caucus for Women in Statistics created an award in F.N. David's name, awarded every years to a woman who exemplifies David's contributions to research, leadership, education, and service.

There's certainly a lot more to Florence Nightingale David than what I included in this post. I highly recommend reading the conversation with her linked above. She also receives some attention in The Lady Tasting Tea. For now, I'll close with a great quote from the linked interview. She commented that being influential is not her job in life. When asked what is her job in life, she said, "To ask questions and try to find the answers, I think."

Monday, August 21, 2017

A Little Cloudy But...

Here's a picture we took of the totality:


We were viewing from North Kansas City, MO, at a relative's home. We got about 1 minute 40 seconds of totality. It was pretty cool how quickly it became dark and then light again.

Almost Time

We'll be heading out shortly to go to our eclipse viewing location. Though we had originally planned on heading over to St. Joseph, MO, reports from locals is that it's going to be incredibly crowded. So we're sacrificing about 30 seconds of totality (fine with all of us) to watch the eclipse from a family member's home in North Kansas City. Right now it's cloudy and storming here, but I checked the weather and this should clear out by noon. And traffic in our area is all green, according to Google.

As I wait for family members to finish getting ready so we can head out, I'm reading this article from the NY Times about what to expect during the eclipse and some of the research that will happen during:
The moon will begin to get in the sun’s way over the Pacific Ocean on Monday morning. This will create a zone that scientists call totality — the line where the moon completely blocks the sun, plunging the sea and then a strip of land across the continental United States into a darkness that people and other living things can mistake for premature evening.

Because of planetary geometry, the total eclipse can last less than one minute in some places, and as long as two minutes and 41 seconds in others. The eclipse’s longest point of duration is near a small town called Makanda, Ill., population 600.
And I'm also enjoying some great eclipse posts:


And remember...

Sunday, August 20, 2017

Statistics Sunday: Odds Ratios

As you may recall, there are different types of variables. Some variables are continuous. But some are categories, and some of those categories consist of two levels, or what we call a dichotomy. A coin flip is one example: we have two outcomes, heads and tails.

Sometimes we need to study - that is, understand what causes or contributes to - two-level outcomes: fracture or no fracture, malignant or benign, present or absent. Some of these variables are non-ordered categories (like heads or tails) while others can be thought of as two-level ordinal outcomes (alive or dead is one example where one outcome is clearly better than the other, but it wouldn't be considered continuous).

While the descriptive statistics for continuous variables would be a mean (and standard deviation) or median, the descriptive statistics for a dichotomous variable would be frequencies and proportions (percentages in decimal form). These proportions could be considered probabilities of a particular outcome. For instance, if you flip a coin enough times, your proportions of heads and tails would both be close to 0.5, meaning the probability of flipping heads, for instance, is 0.5.

On the other hand, you might want to look at probabilities of one outcome versus another with what we call odds. These are expressed as two whole numbers. So if half of your coin flips will be heads (1/2) and half of your coin flips will be tails (1/2), we would express those odds as 1 to 1 (or 1:1). Basically, probabilities are decimals and odds are built from two fractions with the same denominator. They tell you similar things, just in different numerical forms.

Now, what if you want to understand the relationship between two dichotomous variables? The chi-square test is one way that you could do that. But this test just tells us if the combination of these two dichotomous variables show a different relationship than you would expect by chance alone. Also, chi-square is biased to be significant when sample sizes are large, so you might have a statistically significant effect that doesn't have any practical importance.

If you want to understand the strength of a relationship, you need an effect size. One effect size for describing the relationship between two dichotomous variables - one that has some very important applications I'll delve into later - is the odds ratio. An odds ratio tells you how much more likely an outcome is at one level of a dichotomous variable than at the other level: it's the odds of one outcome divided by the odds of the other.

Let's use a practical example. I have a cancer drug I want to test and see if it will cause people to go into remission. I randomly assign people to take my drug or a placebo, and at the end of the study, I run tests to see if their cancer is in remission or not. That means I have two variables (group and outcome) each with two levels (drug or placebo, in remission or not in remission). At the end of the study, I create a 2 x 2 table of frequencies - what's called a 2 x 2 contingency table:

Group
In Remission
Not In Remission
Drug
a
b
Placebo
c
d

Each cell would normally have a frequency, but I've instead given the labels for each cell that would be used for the formula (a-d). The formula for the odds ratio is (a*d)/(b*c).1 If I fill in my table with fake values:

Group
In Remission
Not In Remission
Drug
125
375
Placebo
30
470

and fill in those values for the formula - (125*470)/(375*30) - I get an odds ratio of 5.2. What this means is that people who took my drug are 5.2 times more likely to be in remission at the end of the study than people who took a placebo.

The main problem with the odds ratio is that you can't compute one if any of your cells has a frequency of 0. The resulting odds ratio will either be 0 (if the 0 cell ends up in the numerator) or undefined (if the 0 cell ends up in the denominator). If you encounter this problem but still need to compute an odds ratio, the usual approach is to add 0.5 to all 4 cells.

As I said previously, the odds ratio - and a specific transformation of it - has some very important applications, especially in the work I do as a psychometrician. Look for a post or two on that later!


1Technically, the formula is the odds of one outcome (a/c) divided by the other (b/d), but you can cross-multiply your fractions, resulting in (a*d) divided by (b*c).

Saturday, August 19, 2017

Countdown to the Eclipse

We're just days away from the 2017 total solar eclipse, and I'm writing this from my parents' house in Kansas City. We'll be heading north on Monday to watch the eclipse, since we won't be able to see the totality from here, and we're already equipped with our ISO-compliant eclipse glasses.

Hopefully you, dear reader, have identified where you'll be able to watch the eclipse. And if you're curious about what the eclipse will look like in different locations, Time Magazine has put together this awesome animation: enter a zip code and you'll see animation of what the eclipse will look like there. As an example, here's a GIF of what the eclipse will look like from Goreville, Illinois, which will see a full 2 and a half minutes of totality:


We've also purchased a solar filter for our camera, so we'll be able to get some pictures of the eclipse. Check in Monday for an update!

Thursday, August 17, 2017

Women in the Work Force

Via Bloomberg, the Bureau of Labor Statistics released data showing that the work force participation rate among women has increased by 0.3 percentage points since January, bringing the gap in participation rate between men and women to 13.2 percent.


This is the lowest that gap has been since 1948. However, overall participation in the U.S. is low at 62.9 percent. This is due in part to decreased participation rates among prime-age men:
The declining participation among prime-age male workers has become an area of focus for President Donald Trump’s administration. Trump campaigned on reviving traditionally male-dominated industries such as coal mining and manufacturing that have struggled against greater globalization. Amid record-high job openings, the president has emphasized that Americans need to be open about relocating for work.
You know, like how Trump has relocated for his job, and stopped spending so much time at his penthouse in New York or his resort at Mar-a-Lago.

The reason for the lower participation rate overall, and especially among men, has many potential causes:
Prohibitive childcare costs make parents’ decision to return to work more difficult, and prime-age Americans are feeling the increased burden of caring for an aging population. The opioid epidemic also helps explain why a portion of the workforce is deemed unemployable. And immigration limits imposed by the Trump administration could curb workforce growth in industries such as farming and construction that are dominated by the foreign-born.
The Bloomberg article also highlights some recent work by Thumbtack Inc., which has found increases in women-owned business in traditionally male-dominated professions:
Lucas Puente, chief economist at Thumbtack Inc., sees advances across the industries in which his company matches consumers and professional service workers. While men still make up about 60 percent of the 250,000 active small businesses listing their services on Thumbtack, women are gaining ground more quickly, even among traditionally male-dominated professions. Among the top 10 fastest-growing women-owned businesses on Thumbtack in the past year are plumbers, electricians, and carpenters, according to the company’s survey data.

Wednesday, August 16, 2017

Stats Note: The Third Variable Problem

Correlation does not imply causation. You've probably heard that many times - including from me. When we have a correlation between variable A and variable B, it could be that A caused B, B caused A, or another variable C causes both. A famous example is the correlation between ice cream sales and murder rates. Does ice cream make people commit murder? Does committing  murder make people crave ice cream? Or could it be that warm weather causes both? (Hint: It's that last one.)

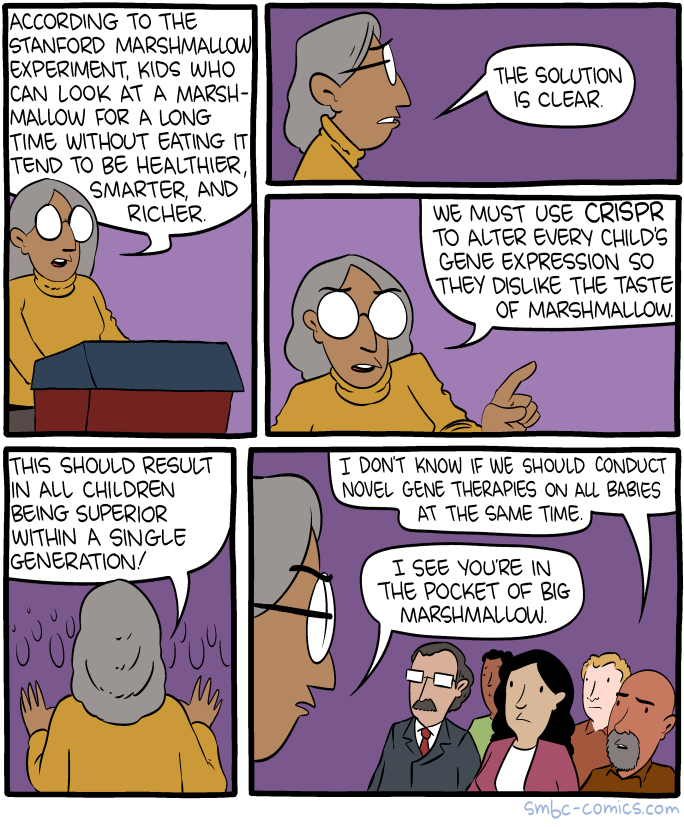
The problem is that when people see a correlation between two things, and get confused about causality, they may intervene to change one thing in the hopes of changing the other. But that's not how it works. For a comedic example, this Saturday Morning Breakfast Cereal comic:


The cartoon references the famous Stanford "Marshmallow Study," which examined whether children could delay gratification. If you'd like to learn even more, the principal investigator, Walter Mischel, wrote a book about it.

Statistical Sins: Reinventing the Wheel - Some Open Data Resources

For today's Statistical Sins post, I'm doing things a little differently. Rather than discussing a specific study or piece of media about a study, I'm going to talk about general trend. There's all this great data out there that could be used to answer questions, but I still see study after study collecting primary data.

Secondary data is a great way to save resources, answer questions and test hypotheses with large samples (sometimes even random samples), and practice statistical analysis.


To quickly define terms, primary data is the term used to describe data you collect yourself, then analyze and write about. Secondary data is a general term for data collected by someone else (that is, you weren't involved in that data collection) that you can use for your own purposes. Secondary data could be anything from a correlation matrix in a published journal article to a huge dataset containing responses from a government survey. And just primary data can be qualitative, quantitative, or a little of both, so can secondary data.

We really don't have a good idea of how much data is floating around out there that researchers could use. But here are some good resources that can get you started on exploring what open data (data that is readily accessible online or that can be obtained through an application form) are available:
  • Open Science Framework - I've blogged about this site before, that lets you store your own data (and control how open it is) and access other open data
  • Data.gov - The federal government's open data site, which not only has federal data, but also links to state, city, and county sites that offer open data as well
  • Global Open Data Index - To find open data from governments around the world
  • Open Data Handbook - This site helps you understand the nature of open data and helps you to make any data you've collected open, but there's also a resources tab that offers some open data sources
  • Project Open Data - Filled with great resources to help you on your open data journey, including some tools to convert data from one form (e.g., JSON files) to an easier-to-use form (e.g., CSV)
  • Open Access Button - Enter in a journal article you're reading, and this site will help you find or request the data
  • GitHub Open Data - Another open data option for some fun datasets, such as this dataset of Scrabble tournament games
And there's also lots of great data out there on social media. Accessing that data often involves interacting with the social media platform's API (application program interface). Here's more information about Twitter's API; Twitter, in general, is a great social media data resource, because most tweets are public. I highly recommend this book if you want to learn more about mining social media data:

Tuesday, August 15, 2017

Every Now and Then: Total Eclipse of the Sun

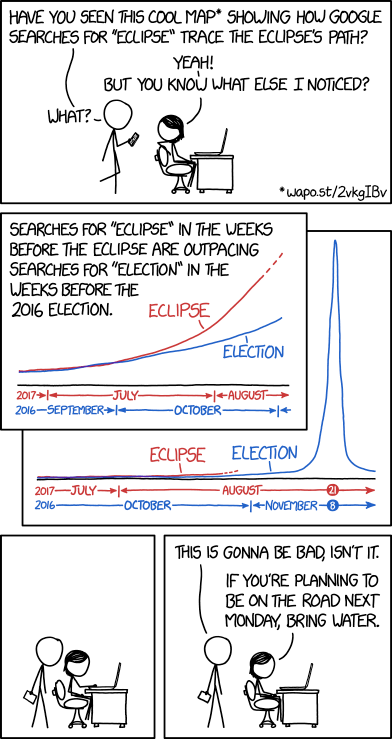
We're less than a week away from the total solar eclipse that will make its way across the United States from Oregon to South Carolina. It seems that everyone is getting in on the fun. For instance, the most recent XKCD:


Sky and Telescope provides this list of apps to use the day of the eclipse.

Unfortunately, some companies are taking advantage of the eclipse frenzy by selling counterfeit glasses - glasses that fail to comply with the proper standards. Amazon has been issuing refunds to people who purchased glasses that may not meet the proper standards. The American Astronomical Society published this list of reputable vendors.

I plan to watch the eclipse from St. Joseph, MO, which is close to where I grew up in Kansas City, KS. (I even applied for and almost accepted a job in St. Jo back in 2010, but opted to work for the VA instead.)

Monday, August 14, 2017

On Charlottesville and Trump

As you probably already know, a rally calling itself "Unite the Right" convened this weekend in Charlottesville, VA, to protest the removal of a monument to Robert E. Lee. The rally quickly turned violent when a car was driven into an anti-racism protest organized as a response to the Unite the Right rally; 19 were injured and 1 was killed. Two state police officers called to assist with maintaining order also died in a helicopter crash.

Many were calling for the President to respond to the rally.


When the President eventually did respond, he failed to distance himself from these individuals and the organizations they represent, and emphasized that there was violence and hatred on many sides:
We condemn in the strongest possible terms this egregious display of hatred, bigotry and violence, on many sides. On many sides. It's been going on for a long time in our country. Not Donald Trump, not Barack Obama. This has been going on for a long, long time.
As Julia Azari of FiveThirtyEight points out, though Presidential responses to racial violence have always been rather weak, Trump's are even weaker.

I walk by Trump Tower in Chicago every day on my way to work. Here's what I saw in front of the building today:


Sunday, August 13, 2017

Statistics Sunday: How Does the Consumer Price Index Work?

You may have heard news stories about how much consumer prices have risen (or fallen) in the last month, like this recent one. And maybe, like me, you've wondered, "But how do they know?" It's all thanks to the Consumer Price Index, released each month by the Bureau of Labor Statistics. The most recent CPI came out Friday.

The CPI is a great demonstration of sampling and statistical analysis, so for today's Statistics Sunday, we'll delve into the history and process of the CPI.

What is the Consumer Price Index?

The CPI is based on prices of a representative sample (or what the Bureau of Labor Statistics calls a "basket") of goods and services - the things that the typical American will buy. These prices, which are collected in 87 urban areas, from about 23,000 retail and service establishments and 50,000 landlords and tenants, are collected each month, then weighted by total expenditures (how much people typically spend on each) from the Consumer Expenditure Survey. What they get as a result is a measure of inflation: how much the price of this sample of goods and services has changed over time. The CPI can also be used to correct for inflation (when making historical comparisons) and to adjust income (for industries that have wages tied to the CPI through a collective bargaining agreement).

What's In the Basket?

The basket is determined from the results of the Consumer Expenditure Survey - the most recent one was in 2013 and 2014. These data are collected through a combination of interviews (often computer-guided, where an interviewer contacts the interviewee in person or over the phone, and asks a series of questions) and diary studies (in which families track their exact expenditures over a two-week period). The interviews and diaries assess over 200 categories of goods and services, that they organize into 8 broad categories:
  • Food and beverages - things like cereal, meat, coffee, milk, and wine
  • Housing - rent, furniture, and water or sewage charges
  • Apparel - clothing and certain accessories, like jewelry
  • Transportation - cost of a new car, gasoline, tolls, and car insurance
  • Medical care - prescriptions, cost of seeing a physician, or glasses
  • Recreation - television, tickets to movies or concerts, and sports equipment
  • Education and communication - college tuition, phone plans, and postage
  • Other goods and services - a catch-all for things that don't fit elsewhere, like tobacco products or hair cuts

How is this Information Collected?

Believe it or not, the people who collect data for the CPI either call or visit establishments to get the prices. The data are sent to commodity experts at the Bureau, who review the data for accuracy, and may make changes to items in the index through direct changes or statistical analysis. For instance, if an item on the list, like a dozen eggs, changes in some way, such as stores selling eggs in packs of 10 instead, the commodity experts have to determine if they should change the index or conduct analysis to correct for changing quantity. This is a pretty easy comparison to make (10 eggs versus 12 eggs), of course, but when the analysts start dealing with two products that may be very different in features (such comparing two different computers or tuition from different colleges), the analysis to equalize them for the index can become very complex. So not only are items weighted to generate the full index, but statistical analysis can occur throughout data preparation for generating the index.

Data for the three largest metropolitan areas - LA, New York, and Chicago - are collected monthly. Data for other urban areas are every other month, or twice a year.

History of the CPI

The history of the CPI can be traced back to the late 1800s. The Bureau of Labor, which later became the Bureau of Labor Statistics, did its first major study from 1888 to 1891. This study was ordered by Congress to assess tariffs they had introduced to help pay off the debt from the Civil War. They were interested in key industrial sectors: iron and steel, coal, textiles, and glass. This is one of the first examples of applying indexing techniques to economic data.

From then on, the Bureau often did small statistical studies to answer questions for Congress and the President. In 1901 to 1903, they broadened their scope by doing a study of family expenditures, as well as analysis of costs from retailers, and applied the indexing techniques they had developed for industry to retail and living expenses. They published the results in a report called Relative Retail Price of Food, Weighted According to the Average Family Consumption, 1890 to 1902 (base of 1890–1899). Despite seeming quite dull from the title and subject matter, this report was actually quite controversial, because it highlighted a gap in growth in wages versus increase in cost of living - that is, wages had grown more than costs, resulting in increased purchasing power. But it was released during a banking crisis, where many people were laid off and wages were cut, so the Bureau was accused of being politically motivated in their research and conclusions.

As a result of the outcry, and budget concerns, research by the Bureau was halted in 1907, and was very limited in scope when it returned in 1911, assessing fewer items and using mail surveys from retailers rather than visits by Bureau staff.

New leadership in the Bureau and the beginning of World War I rekindled research efforts. They began publishing a retail price index twice a year in 1919. But the Bureau got a major redux thanks to the efforts of FDR's Secretary of Labor, Frances Perkins. She made efforts to modernize the organization and recruit experts in the fields of methodology and statistical analysis. Two major contributors were American economist and statistician Helen Wright and British statistician Margaret Hogg. In fact, Hogg conducted analysis that demonstrated the current weights used for the index were biased, by overstating the importance of food, and understating the importance of other goods and services, in the index. When they also made changes to the sample of prices to include, they had to hire more staff to go out and collect price data.

Other major changes in the history of the CPI included introducing an index specific to "lower-salaried workers in large cities" in the early 1940s, a gradual shift from a constant-goods (where the same basket is always used) to a constant-utility (where goods for the basket are determined by level of utility or satisfaction - that is, new useful goods can be added) framework from the 1940s to 1970s, and a partnership with the U.S. Census Bureau in the late 1970s. The first collective bargaining agreements - in which companies agreed to link workers' wages to the CPI to prevent strikes - occurred in the late 1940s and early 1950s.

Summing It All Up

Not only is the CPI an index of inflation - it represents cultural shifts in how we think about and consume goods and services. The shifting basket over time reflects changes in our day-to-day lives, the birth and/or death of different industries, and the changes in technology.

I'll admit, I wasn't really that interested in the CPI until I learned about the contributions of statisticians over the years. And it's an example of women making strong contributions to economic and statistical thought, so it's a shame that we don't hear more about it. In fact, statistician Dr. Janet Norwood, who joined the Bureau in 1963, and served as commissioner from 1979 to 1991, made some very important changes in her time there. For instance, a representative of the policy arm of the Department of Labor sat in on meetings about research results and press released from the Bureau - until Dr. Norwood stopped this practice to make sure economic information was seen as accurate and nonpartisan.

If you're now as fascinated as me, you can learn more about the CPI and its data here.

Saturday, August 12, 2017

Another Response to the Google Memo

On Wednesday, I wrote my own response to the "Google memo" in which I focused on the (pseudo)science used in the memo. I had such a great time writing that post and in chatting with people after that I'm working on another writing project along those lines. Stay tuned.

But I'm thankful to Holly Brockwell, for focusing on the history of women in tech in her response. Because as she points out, women were there all along:
The viewpoint Damore is espousing is known as biological essentialism. It’s used by people who have been told all their lives that they’re special and brilliant, and in moments of insecurity or arrogance, seek to prove this with junk science. Junk science like “women are biologically unsuited to technical work”, which – despite all his thesaurus-bothering, pseudoscientific linguistic cladding (see, I can do it too) – is the reductive crux of his argument.

Damore clearly thinks he’s schooling the world on biology, but it’s actually history he should have been paying attention to. Because he either doesn’t know or has chosen to forget that women were the originators of programming, and dominated the software field until men rode in and claimed all the glory.
Ada Lovelace, author of the first computer algorithm
The fact is, programming was considered repetitive, unglamorous “women’s work”, like typing and punching cards, until it turned out to be a lucrative and prestigious field. Then, predictably, the achievements of women were wiped from the scoreboard and men like James Damore pretended they were never there.

Marie Hicks, author of Programmed Inequality – How Britain Discarded Women Technologists and Lost Its Edge in Computing, believes the subordination of women in computer science has limited progress for everyone.

“The history of computing shows that again and again women’s achievements were submerged and their potential squandered – at the expense of the industry as a whole,” she explains. “The many technical women who were good at their jobs had the opportunity to train their male replacements once computing began to rise in prestige – and were subsequently pushed out of the field.

“These women and men did the same work, yet the less experienced newcomers to the field were considered computer experts, while the women who trained them were merely expendable workers. This has everything to do with power and cultural expectation, and nothing to do with biological difference.”

It might be comforting for mediocre men to believe that they’re simply born superior. That’s what society’s been telling them all their lives, and no one questions a compliment. But when they try to dress up their insecurities as science, they’d better be ready for women to challenge them on the facts. Because really, sexism is just bad programming, and we’d be happy to teach you how to fix it.
In fact, some of the first women to contribute to statistics did so as human computers, who worked for many hours repeating calculations on mechanical calculators to fill in the tables of critical values and probabilities to accompany statistical tests.

Friday, August 11, 2017

Made for Math

Via NPR, research suggests that we're all born with math abilities, which we can hone as we grown:
As an undergraduate at the University of Arizona, Kristy vanMarle knew she wanted to go to grad school for psychology, but wasn't sure what lab to join. Then, she saw a flyer: Did you know that babies can count?

"I thought, No way. Babies probably can't count, and they certainly don't count the way that we do," she says. But the seed was planted, and vanMarle started down her path of study.

What's been the focus of your most recent research?

Being literate with numbers and math is becoming increasingly important in modern society — perhaps even more important than literacy, which was the focus of a lot of educational initiatives for so many years.

We know now that numeracy at the end of high school is a really strong and important predictor of an individual's economic and occupational success. We also know from many, many different studies — including those conducted by my MU colleague, David Geary — that kids who start school behind their peers in math tend to stay behind. And the gap widens over the course of their schooling.

Our project is trying to get at what early predictors we can uncover that will tell us who might be at risk for being behind their peers when they enter kindergarten. We're taking what we know and going back a couple steps to see if we can identify kids at risk in the hopes of creating some interventions that can catch them up before school entry and put them on a much more positive path.

Your research points out that parents aren't engaging their kids in number-learning nearly enough at home. What should parents be doing?

There are any number of opportunities (no pun intended) to point out numbers to your toddler. When you hand them two crackers, you can place them on the table, count them ("one, two!" "two cookies!") as they watch. That simple interaction reinforces two of the most important rules of counting — one-to-one correspondence (labeling each item exactly once, maybe pointing as you do) and cardinality (in this case, repeating the last number to signify it stands for the total number in the set). Parents can also engage children by asking them to judge the ordinality of numbers: "I have two crackers and you have three! Who has more, you or me?"

Cooking is another common activity where children can get exposed to amounts and the relationships between amounts.

I think everyday situations present parents with lots of opportunities to help children learn the meanings of numbers and the relationships between the numbers.

Great Minds in Statistics: Happy Birthday, Egon Pearson!

Today would have been Egon Pearson's 112th birthday. So happy birthday, Egon Pearson and welcome to the first Great Mind in Statistics post!

So just to be clear:

Not that Egon
Not that Pearson - this is Karl Pearson
Egon Pearson
Egon Pearson was born August 11, 1895, the middle child of Karl Pearson and Maria (Sharpe) Pearson. His father, K. Pearson, was a brilliant statistician who also brought petty to a new level; look for a profile of him later. But young Pearson contributed to classical statistics - and helped originate an approach called null hypothesis significance testing - while avoiding the pettiness of his father, and the ongoing feud between Jerzy Neyman (Egon's frequent collaborator) and Ronald Fisher (who was also a frequent thorn in Karl Pearson's side). Rather, Egon tried to avoid these feuds, though he sometimes got caught up in them - after all, Fisher could be petty too.

Unfortunately, Egon is often forgotten in the annals of statistics history. In fact, his name is either inexorably tied to Neyman's - as in their collaboration together - or left out, and Neyman is discussed alone. Unlike his father, Egon was shy and meticulous, and avoidant of conflict. His collaboration with Neyman began when they met in 1928. And shortly after meeting, Egon proposed a problem to Neyman.

Karl developed the goodness of fit test, which examines whether observed data fit a theoretical distribution, such as the normal distribution (also see here). But up to that point, there were many different approaches to this test and no best practice or standard procedure. Egon posed the question to Neyman: how should one proceed if one test indicates good fit and another poor fit? Which one should be trusted?

Together, they tackled the problem, and even incorporated Fisher's likelihood function, then published the first of their joint papers in which they examined the likelihood associated with goodness of fit.

You'd think building on his dad's work would have made papa proud, but apparently, Egon was so concerned about angering his father by incorporating Fisher's work (like I said, K. Pearson was petty), he and Neyman actually started a new journal, Statistical Research Memoirs, rather than publish in K. Pearson's journal Biometrika. But don't worry; Egon took over Biometrika as editor when his father retired. He also inherited his father's role of Department Head of Applied Statistics at University College London.

He didn't always live in K. Pearson's or Neyman's shadows. He contributed great deal to the statistical concept of robustness - a statistical analysis is robust if you can still use despite departures from assumptions of normality - and even proposed a test for normality based on skewness and kurtosis. His work on the statistics of shell fragmentation was an important contribution to efforts during World War II, and he received a CBE (Commander of the Most Excellent Order of the British Empire) for his service. He presided as President of the Royal Statistical Society from 1955 to 1956, and was elected a Fellow with the society (a high honor) in 1966.

Egon Pearson died on June 12, 1980 in Midhurst, Sussex, England.