Showing posts with label beer. Show all posts

Saturday, June 30, 2018

What I Did on My Week's Vacation

It's been quite a week. I traveled to Kansas City Monday to spend time with my family. Tuesday was my parents' 47th wedding anniversary. Unfortunately, we ended up spending part of Tuesday at the ER when my dad's breathing problems were exacerbated by the hot weather and their air conditioner dying over the weekend. In fact, I was at the ER when a tornado warning was issued in Kansas City, MO, and I spent that time hunkered down in a back hallway waiting for it to pass. It turned out to be a small tornado, mostly knocking over some trees and dropping golf ball sized hail on part of the city. We returned home to restored air conditioning and a beautiful (but hot) rest of the day.

Wednesday, we stayed in and got take-out from Joe's Kansas City BBQ.

Thursday, I finally took the Boulevard Brewery tour, starting with a glass of Tank 7, and got to see the brewing operation.

Our tour guide showing where the brewery began.
This section was the entire operation in 1989, but now is used for experimental beers.

The centrifuge that filters the beer. If this thing ever broke down, we're told it would send a stream of beer at such force, we'd be sliced in half. We decided to refer to that phenomenon as a "beersaber."

The tour ended with a beer and food tasting, featuring The Calling Double IPA and an open-faced ham sandwich with Clementine-Thyme marmalade, The Sixth Glass Quadrupel with brie and fig, The Bourbon Barrel-Aged Quadrupel (BBQ, made from The Sixth Glass aged in bourbon barrels and my favorite from the tasting) and goat-cheese cheesecake with blackberry, and The Dark Truth Imperial Stout and a chocolate chip cookie. All food came from KC restaurants and bakeries.

I picked up some yummy beer, including a four-pack of the BBQ, and a jar of the marmalade to bring home to Chicago.

I did a lot of writing - more on that (and hopefully some good news) later - and finished a couple books. Now, back to Chicago!

Thursday, June 14, 2018

Working with Your Facebook Data in R

How to Read in and Clean Your Facebook Data - I recently learned that you can download all of your Facebook data, so I decided to check it out and bring it into R. To access your data, go to Facebook, and click on the white down arrow in the upper-right corner. From there, select Settings, then, from the column on the left, "Your Facebook Information." When you get the Facebook Information screen, select "View" next to "Download Your Information." On this screen, you'll be able to select the kind of data you want, a date range, and format. I only wanted my posts, so under "Your Information," I deselected everything but the first item on the list, "Posts." (Note that this will still download all photos and videos you posted, so it will be a large file.) To make it easy to bring into R, I selected JSON under Format (the other option is HTML).


After you click "Create File," it will take a while to compile - you'll get an email when it's ready. You'll need to reenter your password when you go to download the file.

The result is a Zip file, which contains folders for Posts, Photos, and Videos. Posts includes your own posts (on your and others' timelines) as well as posts from others on your timeline. And, of course, the file needed a bit of cleaning. Here's what I did.

Since the post data is a JSON file, I need the jsonlite package to read it.

setwd("C:/Users/slocatelli/Downloads/facebook-saralocatelli35/posts")
library(jsonlite)

FBposts <- fromJSON("your_posts.json")

This creates a large list object, with my data in a data frame. So as I did with the Taylor Swift albums, I can pull out that data frame.

myposts <- FBposts$status_updates

The resulting data frame has 5 columns: timestamp, which is in UNIX format; attachments, any photos, videos, URLs, or Facebook events attached to the post; title, which always starts with the author of the post (you or your friend who posted on your timeline) followed by the type of post; data, the text of the post; and tags, the people you tagged in the post.

First, I converted the timestamp to datetime, using the anytime package.

library(anytime)

myposts$timestamp <- anytime(myposts$timestamp)

Next, I wanted to pull out post author, so that I could easily filter the data frame to only use my own posts.

library(tidyverse)
myposts$author <- word(string = myposts$title, start = 1, end = 2, sep = fixed(" "))

Finally, I was interested in extracting URLs I shared (mostly from YouTube or my own blog) and the text of my posts, which I did with some regular expression functions and some help from Stack Overflow (here and here).

url_pattern <- "http[s]?://(?:[a-zA-Z]|[0-9]|[$-_@.&+]|[!*\\(\\),]|(?:%[0-9a-fA-F][0-9a-fA-F]))+"

myposts$links <- str_extract(myposts$attachments, url_pattern)

library(qdapRegex)
myposts$posttext <- myposts$data %>%
  rm_between('"','"',extract = TRUE)

There's more cleaning I could do, but this gets me a data frame I could use for some text analysis. Let's look at my most frequent words.

myposts$posttext <- as.character(myposts$posttext)
library(tidytext)
mypost_text <- myposts %>%
  unnest_tokens(word, posttext) %>%
  anti_join(stop_words)
## Joining, by = "word"
counts <- mypost_text %>%
  filter(author == "Sara Locatelli") %>%
  drop_na(word) %>%
  count(word, sort = TRUE)

counts
## # A tibble: 9,753 x 2
##    word         n
##    <chr>    <int>
##  1 happy     4702
##  2 birthday  4643
##  3 today's    666
##  4 song       648
##  5 head       636
##  6 day        337
##  7 post       321
##  8 009f       287
##  9 ð          287
## 10 008e       266
## # ... with 9,743 more rows

These data include all my posts, including writing "Happy birthday" on other's timelines. I also frequently post the song in my head when I wake up in the morning (over 600 times, it seems). If I wanted to remove those, and only include times I said happy or song outside of those posts, I'd need to apply the filter in a previous step. There are also some strange characters that I want to clean from the data before I do anything else with them. I can easily remove these characters and numbers with string detect, but cells that contain numbers and letters, such as "008e" won't be cut out with that function. So I'll just filter them out separately.

drop_nums <- c("008a","008e","009a","009c","009f")

counts <- counts %>%
  filter(str_detect(word, "[a-z]+"),
         !word %in% str_detect(word, "[0-9]"),
         !word %in% drop_nums)

Now I could, for instance, create a word cloud.

library(wordcloud)
counts %>%
  with(wordcloud(word, n, max.words = 50))

In addition to posting for birthdays and head songs, I talk a lot about statistics, data, analysis, and my blog. I also post about beer, concerts, friends, books, and Chicago. Let's see what happens if I mix in some sentiment analysis to my word cloud.

library(reshape2)
## 
## Attaching package: 'reshape2'
counts %>%
  inner_join(get_sentiments("bing")) %>%
  acast(word ~ sentiment, value.var = "n", fill = 0) %>%
  comparison.cloud(colors = c("red","blue"), max.words = 100)
## Joining, by = "word"

Once again, a few words are likely being misclassified - regression and plot are both negatively-valenced, but I imagine I'm using them in the statistical sense instead of the negative sense. I also apparently use "died" or "die" but I suspect in the context of, "I died laughing at this." And "happy" is huge, because it includes birthday wishes as well as instances where I talk about happiness. Some additional cleaning and exploration of the data is certainly needed. But that's enough to get started with this huge example of "me-search."

Wednesday, May 9, 2018

Updates

Since 2005 or 2006, I've been going to a place called Beer Bistro. We hang out there after (and sometimes before) choir rehearsal and I met my husband here in 2007. I found out it's closing this week. After all the memories I have of this place, it feels like a chapter of my life is closing. I had to go back one last time, so I visited last night after work, enjoying it in my favorite way to enjoy a bar: with a beer and a book.


This morning, I received my feedback from the 2nd round of the NYC Midnight Short Story Competition - my 1st round story came in 3rd in my heat, with the top 5 in each heat advancing. In round 2, only the top 3 advance. My story came in 1st in my heat!


Round 3 assignments release Friday night and I'll have 24 hours to write a 1500 word short story. This is also the weekend I'll be working all day Saturday, so this is going to be a busy weekend. I suspect I'll be staying up late Friday to get as much writing as I can done, then work on it more during my commute Saturday morning and breaks/lunch during the day Saturday.

Thursday, February 15, 2018

So Does that Make it Nine Floyds?

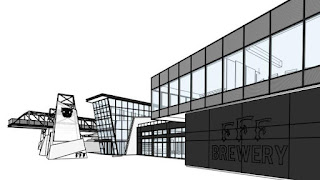
Three Floyds Brewery in Munster, Indiana has plans to triple their current space, with a new glass-walled building that would feature a larger brewpub, outdoor seating, more parking, and of course, more space for brewing:
The plans — which look more like a vision from the tech industry than craft brewing — were posted last week on the town of Munster’s website. Town officials have been hammering out details of the expansion with Three Floyds since September.

Munster Town Manager Dustin Anderson said he expects formal approval by March. The new brewery would likely be completed in 2019 or 2020.

Three Floyds bought multiple lots around its brewery in 2014 to expand brewing production and build a distillery. The new plans calls for Three Floyds to continue building outward from its existing operation, including construction on an undeveloped lot north of the distillery and a lot south of the brewery that formerly housed another business.

“We’re thrilled,” Anderson said. “Three Floyds is a great neighbor and asset for the community, and we’re glad they’re choosing to expand in Munster.”
I'm a big fan of Three Floyds, and have visited their brewpub a couple of times, which can fill up quickly. I can't wait to visit their shiny new facility!

Friday, November 17, 2017

Candy is Dandy But Liquor is Quicker

In yesterday's Chicago Tribune, Josh Noel longs for the day when beer tasted like beer:
After six hours wandering the aisles of the Festival of Wood and Barrel-Aged Beer last weekend, I have concluded that craft beer is betraying itself. It is forgetting what beer should taste like.

Though FOBAB, held this year at the University of Illinois at Chicago Forum on Friday and Saturday, remains Chicago’s most essential beer festival, corners of it have become a showcase for beer that tastes more like dessert than beer. “Pastry stouts,” the industry calls them.

Among the 376 beers poured at FOBAB this year, about 50 were pastry stouts, the largest share of the largest category at FOBAB. [These] beers are overrun with coffee, vanilla beans, coconut, cinnamon, chiles and cacao nibs.

So very many cacao nibs.

It’s a confounding moment in craft beer. The industry is still growing rapidly — 6,000 breweries operating and hundreds more in planning — and the race is on for differentiation. The problem is that the differentiation is seeming both too sweet and too repetitive.
I'll admit, I'm torn on this issue. I completely agree that many of these beers are far too sweet, not really tasting "like beer" but more like flavored syrup. But this isn't a new phenomenon. For instance, look at Reinheitsgebot, the German Beer Purity Laws, which were established centuries ago. I'm sure many of the beers Noel holds up as examples that "taste like beer" would fail to pass these purity laws.

If we go back to the very beginning of brewing - and that's a long way back, because beer is one of the first beverages humans produced; it even predates wine by about 2000 years - the first drinks we call beer are absolutely nothing like what we have today, brewed from barley and different kinds of grain. What makes something beer isn't so much about flavor or even the precise ingredients, but the process used to make it.

One of the reasons I love beer is the nuances of flavor. The many different varieties of beer have resulted from centuries of innovation. And I'm sure as each new style was invented, someone was lamenting for the days when the beer tasted like beer. While I may not love the pastry stouts, and instead prefer beers that are more dry or bitter, I don't see any issue with this new trend. It highlights exactly what I love about beer - variety.

Besides, I'll try anything barrel-aged, even if I worry it will be too sweet for me.

Thursday, November 16, 2017

Finding Utopia

After an especially long workday yesterday, that started around 8:30 am and ended around 8:00 pm, I decided to grab a burger and a beer at one of my favorite beer gardens. Not only did I get to catch the end of the Hawks game, I was thrilled to see that they had Samuel Adams Utopias 2017 on their draft menu.


You might remember I posted about this beer a little over a week ago. This 2 ounce pour cost me $26, much cheaper than picking up my own bottle for $199 - not to mention, I'd need a bunch of friends to share that bottle with, since this beer comes in at 28% ABV. This is a beer one should sip slowly, and I did - my dinner companion finished an entire pint in the time it took me to finish my 2 ounces.

The beer was lovely: rich, malty, and slightly sweet. It's served room temperature, as most cask-aged beers are, and is not carbonated, because of the high alcohol content. If you're a beer-lover and get the chance to try it, I highly recommend it.

Tuesday, November 14, 2017

Where Serendipity Takes Me

I'm having one of those evenings where you feel like there is some strange force in the universe guiding you. Generally I don't believe in that kind of thing. But every once in while, things like this happen in a chain that feels anything but random.

It's Tuesday, when I have belly dance class, which means I drive to work and head up to Evanston after the workday.

On my way to Evanston, one of my favorite songs ever comes on the radio: Head Over Heels by Tears for Fears. It was on a station I don't normally listen to but I had switched over due to an incredibly annoying ad on my usual station.

I realize I'm craving tacos so I stop in one of my favorite restaurants where I run into two good friends and have some delicious chicken tacos.

On my way out, I stop to pet a very sleepy 8-week-old golden retriever.

I round the corner to my class... and see the lights are dark and a closed sign is on the door. I think about returning to the taco place but instead decide to head to my favorite tap room.

So now I'm writing and listening to an Irish folk duo while sipping beer.

Life is good.

Tuesday, November 7, 2017

Link Roundup

As I continue working on our content validation study, I have a bunch of links open that I'll read as a reward for finishing my next big task:
  • So good it really is illegal: Apparently Samuel Adams released a beer that costs $199 and is 28% ABV, making it illegal in 12 states. The beer, called Utopias (hmmm, wonder why?), is a mixture of various batches, some of which have been aged 24 years. The aging process is done in a variety of wooden barrels, including barrels for Bourbon, White Carcavelos, Ruby Port, Aquavit, and Moscat. The recommended serving size is 1 ounce.
  • Janelle Shane over at AIWeirdness (who gave us neural network paint names) is celebrating NaNoWriMo by using a neural network to generate some first lines for a potential novel. The results ranged from bizarre nonsense to strange poetry. Also, she's asking readers to share first lines, including their own first lines from novels they've written/are writing. Contribute using this form. I hit a bit of a wall in my own novel, and barely wrote this weekend. So on my train ride this morning, I started working on the outline I said I wasn't going to make. While I'd love to follow Stephen King's writing advice exactly, I'm just too much of a plantser.
  • Today's Google Doodle honors Pad Thai. And now I'm craving noodles.

Thursday, October 26, 2017

Stuff to Read Later

Here are my currently open tabs, that I'm hoping to read at some point today:
  • Actress and writer Brit Marling talks about why gender inequality feeds into rape culture and complicates the issue of consent
  • Kristen Kieffer at Well-Storied.com offers some advice on rocking NaNoWriMo this year, including a great tip - have a back-up story in case you run out of steam on your chosen project; I'm way ahead of you Kristen
  • Google engineer, Felix Krause, shows that iPhone apps with camera permission can surreptitiously record or photograph you, with either front or back camera
  • In India, a near-complete ichthyosaur (a marine reptile) was found
  • The Forté Handbell Quartet plays an incredible handbell rendition of the Hallelujah chorus; considering all the running involved, we'll forgive them for a slightly over-the-top ritardando near the end
  • And finally, just for fun, Deschutes offers beer pairings for your favorite Halloween candy

Tuesday, October 24, 2017

Want to Write a Bad Novel with Me?

November is 8 days away! What? When did this happen?

I know, hard to believe. And I'm super excited because I can't wait to start on my novel for NaNoWriMo. In fact, I keep oscillating between two different story ideas, so I'm tempted to sit down in front of my computer November 1st and see what I start typing. Will it be my story of an introverted hero who turns the comic book genre on its head? Or the story of a woman who loses her job, moves back in with her parents, and sees where her childhood friends have ended up (for better or worse)? Or maybe something else entirely...

So I was thrilled when a non-writing newsletter I subscribe to included a link to this blog post by Beth Skwarecki on how she binge writes bad novels every November. And she urges you to do the same - because writing a book in 30 days means you have to adopt some rules: just keep writing, don't edit and don't look back:
50,000 words in a month is 1,667 per day. At an average typing speed, you could finish your day’s quota in an hour. But that assumes you already know what you’re going to write.

After agonizing over the first chapter for days, I realized that I could not make each chapter perfect the first time. I started writing chapters quickly, badly, with notes about what to fix when I had the time. Pretty soon the book was flying along, and I even had time before deadline to go back and edit it to perfection. If I had insisted on polishing each chapter as I wrote it, I never would have finished.

Rewriting might make your first chapter better, but it will not get you any closer to your goal of actually finishing a draft of a novel. As NaNoWriMo founder Chris Baty says, revisiting what you’ve already written is like turning around in the middle of a marathon to try to run the earlier miles better.

So when anybody would ask if a novel written in a month-long haze of caffeine could possibly be any good, I gleefully answered that of course my novel will be terrible!

And that’s why you write another draft. But don’t worry about that now. Edits are for December.
And if you want to procrastinate during your writing learn some tricks of the trade, Beth recommends this blog.

I'll probably be carrying my laptop or at least a notebook with me most of the time in November. I have my morning and evening commute, during which I can write, and I've found some great coffee shops and bars near my job that are quiet enough to hang out and write in during evenings after work.

I'm planning on adding a widget to this blog to show where I am in terms of word count.

Friday, August 4, 2017

The Rise of Craft Beer

Yesterday, CityLab posted a story by Joe Eaton on one of my favorite topics: beer. Part of the story he writes about Missoula, Montana, which has seven local breweries:
Good beer has joined fly-fishing and other forms of outdoor adventure as a cornerstone of the area’s tourism promotions and is increasingly central to the town’s branding as a hip Western recreational outpost. Accordingly, encouraging the growth of the local brewing industry has become a focus of the region’s economic development efforts.

Across the country, it’s the same story: Craft beer is on a tear, and cities as diverse as Bend, Oregon and Grand Rapids, Michigan have become destinations for connoisseurs of local suds. As Curbed’s Patrick Sisson recently detailed, small breweries have been heralded as economic drivers than can breathe life into the boarded-up downtowns of rural America and inject a hipster vibe—and money—into struggling neighborhoods of larger cities.

But despite the fizzy rise of craft beer in America, there are limits on the power of the industry to drive local economies. Just where that line lies is something that Missoula may soon be discovering.
Breweries have the power to bring jobs back to small towns - especially for people who previously worked in manufacturing, and were forced to take lower paying jobs when manufacturing dried up. As the article states, local taprooms also have the power to build a community, a place where people can meet and interact.

But, as the article also points out, there's a lot of competition for business, and other than tourists coming to town to visit the taprooms, there's a limit to how much beer a town can consume. If an operation is very small and doesn't go into bottling and distribution, they depend on people coming to their taproom and not somewhere else. Although there's argument about whether this market is saturated, in some towns, it may be. Chicago can sustain multiple breweries, but maybe not Missoula, a town of 70,000 that, in addition to the seven breweries noted above, is getting two more.

Taprooms are also attacked for taking business away from bars, and strong voices in the community against bringing a taproom to their neighborhood has resulted in some silly compromise policies (including in Missoula): a 3-pint maximum and 8 PM last call.

Far from discouraging any readers who are thinking of setting up their own small brewery, the author discusses that some markets may have reached (or are in danger of reaching) saturation, but there are other parts of the country lacking in small breweries.

BTW, in reference to my previous post about Certified Independent Craft Beer, I was at Sketchbook Brewing in Evanston, IL earlier this week and saw this hanging on the wall:

Saturday, July 8, 2017

But Is This Really Craft Beer?

Craft beer has become incredibly popular recently. For beer-lovers like me, this is a great trend, because it means I get to try new beers without having to go to specialized stores or visit tap rooms all over the country (though there are many maps available on the internet that show how you can go on the ultimate brewery road trip).

But as craft beer becomes more and more popular, you'll also see more large beverage manufacturers buying up small breweries, so they can cash in on those craft beer sales. But I think part of the reason that craft beer is so popular is because of the difference in flavor when a small brewery makes it, as opposed to the more homogenized (and frequently bland) choices from macro-breweries. And unless you follow beer news, you might not know when your favorite micro-brewery is purchased by a larger beverage manufacturer - and even if you know such a purchase took place, you might not know right away whether that will affect the taste of the beer.

So, how can you tell if what you're drinking is truly craft beer? Via The Daily Parker, this story from the Chicago Tribune details a new initiative by the Brewers Association to label Certified Independent Craft Beer:
More than 800 breweries — including Sam Adams, Sierra Nevada and New Belgium — will soon begin printing seals on their beers that identify them as "Certified Independent Craft." The initiative, which was spearheaded by the trade group for independent craft brewers, is intended to differentiate "true" craft beers from those made by the likes of MillerCoors, Anheuser-Busch and Heineken.

To qualify to use the seal, breweries cannot be more than 25% owned or controlled by any alcohol company that's not itself a craft brewer. Its annual production also can't exceed 6 million barrels.
Here's what the seal will look like:


This afternoon, I'll probably hang out and enjoy some local craft brew - I've got half a growler left of Keweenaw Brewing Company's Level 92 black IPA in the fridge.

Thursday, July 6, 2017

Booze News and the Issue of Bias in Scientific Research

Via The Daily Parker, a new study is going to examine the question of whether alcohol is good for you:
Now the National Institutes of Health is starting a $100 million clinical trial to test for the first time whether a drink a day really does prevent heart attacks. And guess who is picking up most of the tab?

Five companies that are among the world’s largest alcoholic beverage manufacturers — Anheuser-Busch InBev, Heineken, Diageo, Pernod Ricard and Carlsberg — have so far pledged $67.7 million to a foundation that raises money for the National Institutes of Health, said Margaret Murray, the director of the Global Alcohol Research Program at the National Institute on Alcohol Abuse and Alcoholism, which will oversee the study.

The international effort to study the benefits and risks of alcohol will recruit nearly 8,000 volunteers age 50 or older at 16 sites around the world, starting at medical centers in the United States, Europe, Africa and South America. Participants will be randomly assigned to quit alcohol altogether or to drink a single alcoholic beverage of their choice every day. The trial will follow them for six years to see which group — the moderate drinkers or the abstainers — has more heart attacks, strokes and deaths. The study organizers conceded that it would be a challenge to recruit volunteers, who will not know in advance whether they will be assigned to abstain or be required to drink. Those in the drinking group will be partly reimbursed for the cost of the alcohol.
Obviously, it's concerning when companies with everything to gain from the research provide the funding. Not only that, but many of the researchers involved have pre-existing relationships with different manufacturers. There are still ways that the research could be conducted in an unbiased way, and the issue of how bias impacts research is one of the components of different philosophy of science perspectives. That is, the question of whether we can truly know reality through the scientific method and whether complete impartiality is necessary to measure reality has been a topic of philosophical debate for centuries.

It's also important to note that, while the researchers' relationships with various organizations may signal bias, these relationships are also due to the fact that these researchers are well-established and respected in this area of research. Sure, someone without these ties might be more impartial, but they also don't have the previous experience and knowledge to conduct this type of research. And granting agencies always look for a track record, and would rarely fund studies in a topic new to the particular researcher - and certainly not large, multi-year, multi-site studies such as this.

The more interesting issue, though, is the pledging of private funds to NIH. Obviously, this has been going on before now, but I think this will be a new trend in scientific research - as our government continues to pull funds and slash budgets of scientific granting agencies, you'll see more and more research being conducted and/or funded by private organizations. True, this introduces bias, because few private organizations will fund research that does not benefit them. But when the choice is no money or money with potential strings attached, I can imagine what most researchers will choose - the option that might feel dirty, but is better than being out of a job.

In other news, I can't believe I don't have a "beer" label for my blog. That must be remedied...

Tuesday, June 27, 2017

That's a Lot of Beer

Apparently, I've checked over 175 American beers on Untappd:


I was also reminded by Untappd today that this is my one year anniversary of using the app. So in the last 365 days, I've checked in 175 different American beers - not to mention other, non-American beers. 

I feel I should mention these were not always full pints - usually they were tasters and/or flights. 

I'm both proud of myself and concerned I look like an alcoholic. I just really like beer. 

Friday, June 16, 2017

Updates

I haven't blogged in the last few days. Why? I'm back in Colorado again. (Sing that last line to the tune of Aerosmith's Back in the Saddle if you could.) A family health issue called me back and I'm writing this post from a dingy motel room with a large no smoking sign that I find hilarious because the room reeks of smoke - but it was the only place with a room available not too far from the hospital. But hey, I'm in Colorado, so here's what I'm doing for fun:
  • Trying all the Colorado beer - I'm currently having New Belgium Voodoo Ranger IPA in my dingy motel room; but I've recently had: Breckenridge Mango Mosaic Pale Ale; a flight at Ute Pass Brewing Company that included their Avery IPA, High Point Amber, Sir Williams English Ale, and Kickback Irish Red plus a tap guest of Boulder Chocolate Shake Porter; and an Oskar Blues Blue Dream IPA
  • Listening to all the podcasts, including an excellent one about how beer works from Stuff You Should Know, as well as some of my favorite regular podcasts from Part-Time Genius, WaPo's Can He Do That?, FiveThirtyEight Politics, StarTalk, Overdue, and Linear Digressions
  • Enjoying three new albums: Spoon's Hot Thoughts, Lorde's Melodrama, and Michelle Branch's (She's still making music! My college self is thrilled!) Hopeless Romantic
  • Reading The Black Swan: The Impact of the Highly Improbable by Nassim Nicholas Taleb, which Daniel Kahneman said "changed my view of how the world works"; Kahneman, BTW, is a social psychologist with a Nobel Prize in Economics
  • Also reading (because one can never have too many books) Sports Analytics and Data Science: Winning the Game with Methods and Models by Thomas W. Miller - because I've been trying to beef up my data science skills and thought doing it with data I really enjoy (i.e., sports data) would help motivate me
  • Acquiring new skills such as hitching a fifth wheel (sadly I didn't discover or watch this video until long after hitching the fifth wheel), driving about 70 miles with said fifth wheel, and storing said fifth wheel - I'm considering adding these skills to my résumé
Tomorrow, I'm planning to spend a few hours checking out the Colorado Renaissance Festival. For now, here's a picture from the Garden of the Gods today:

Friday, May 26, 2017

Sara's Week in Psychological Science: Conference Day #1

Today was my first full day at the conference - the annual meeting of the Association for Psychological Science. (Last night's post was hastily written on my phone while enjoying a beer and dessert, hence the lack of links.)

I'll be presenting a poster tomorrow afternoon. In the meantime, I've been sitting in interesting presentations today.

First up this morning was a panel on psychometric approaches. There was a lot of attention given to Bayesian approaches, and this just signals to me something I've suspected for a while - I should learn Bayesian statistics. I'll probably write more about this approach in a future Statistics Sunday post, but to briefly summarize, Bayesian statistics deal with probability differently than traditional statistics, mostly in the use of "priors" - prior information we have about the thing we're studying (such as results from previous studies) or educated guesses on what the distribution might look like (for very new areas of study). This information is combined with the data from the present study to form a "posterior" distribution. There are some really interesting combinations of Bayesian inference with item response theory (a psychometric approach, which I've blogged about before and should probably discuss in more detail at some point). One great thing about Bayesian approaches is that they don't require normally distributed data.

The panel was devoted to the benefits and drawbacks of different kinds of psychometric models and the research situations in which you should use special models - here's one of my favorite slides of the panel:


I also attended a presentation for a brand new journal, Advances in Methods and Practices in Psychological Science, which will be publishing its first issue early next year:
The journal publishes a range of article types, including empirical articles that exemplify best practices, articles that discuss current research methods and practices in an accessible manner, and tutorials that teach researchers how to use new tools in their own research programs. An explicit part of the journal’s mission is to encourage discussion of methodological and analytical questions across multiple branches of psychological science and related disciplines. Because AMPPS is a general audience journal, all articles should be accessible and understandable to the broad membership of APS—not just to methodologists and statisticians. The journal particularly encourages articles that bring useful advances from within a specialized area to a broader audience.
I already have an idea for a paper I'd like to submit.

The last session of the day I attended was on implicit bias, and how they impact real-world interactions between police and community members, doctors and patients, and employers and employees.

All that's left is a reception tonight. At the moment, I'm relaxing in my hotel room before heading out to try a German restaurant with an excellent beer selection.

Monday, April 24, 2017

T-Test in Action

If you wanted to see a t-test in action, you've come to the right place. (If watching me conduct statistical analyses isn't what you were hoping for, I don't know what to tell you. Here's a video of two corgis playing tetherball.)

This month, I've been using an ongoing example of a study on the effect of caffeine on test performance. In fact, in my post on p-values, I gave fictional means and standard deviations to conduct a t-test. All I told you was the p-value, but I didn't go into how that was derived.

First, I used those fictional means and standard deviations to generate some data. I used the rnorm function in R to generate two random samples that were normally distributed and matched up with the descriptive statistics I provided. (And since the data are fake anyway, I've made the dataset publicly available in a tab-delimited here. For the group variable, 0 = control and 1 = experimental.) So I have a sample of 60 people, 30 in each group. I know the data are normally distributed, which is one of the key assumptions of the t-test. The descriptive data is slightly different from what I reported in the p-value post; I just made up those values on the spot, but what I have from the generated data is really close to those values:

Experimental group: M = 83.2, SD = 6.21
Control group: M = 79.3, SD = 6.40

The difference in means is easy to get - you just subtract one mean from the other. The difference between groups is 3.933. The less straightforward part is getting the denominator - the pooled standard error. I'm about to get into a more advanced statistical concept, so bear with me.

Each sample has their standard deviation you can see above. That tells you how much variation among individuals to expect by chance alone. But when you conduct a t-test of two independent samples (that is, no overlap or matching between your groups), you're testing the probability that you would get a mean difference of that size. The normal distribution gives you probabilities of scores, but what you actually want to compare to is the probability of mean differences, where each sample is a collective unit.

Your curve is actually a distribution of mean differences, and your measure of variability is how much samples deviate from the center of that distribution (the mean of mean differences). Essentially, that measure of variability is how much we would expect mean differences to vary by chance alone. We expect mean differences based on larger samples to more accurately reflect the true mean difference (what we would get if we could measure everyone in the population) than smaller samples. We correct our overall standard deviation by sample size to get what we call standard error (full name: standard error of the difference). In fact, the equation uses variance (s2) divided by sample size for each group, then adds them together and takes the square root to get standard error.


Using the two standard deviations above (squared they are 38.51 and 40.96, respectively), and plugging those values into this equation, our standard error is 1.63. If we divide the mean difference (3.933) by this standard error, we get a t of 2.41. We would use the t-distribution for a degrees of freedom of 58 (60-2). This t-value corresponds to a p of 0.02. If our alpha was 0.05, we would say this difference is significant (unlikely to be due to chance).

You could replicate this by hand if you'd like. You'd have to use a table to look up your p-value, but this would only give you an approximation, because the table won't give you values for every possible t. Instead, you can replicate these exact results by:
  • Using an online t-test calculator 
  • Pulling the data into Excel and using the T.TEST function (whichever group is array 2, their mean will be subtracted from the mean of array 1, so keep in mind depending on how you assign groups that your mean difference might be negative; for tails, select 2, and for type, select 2)
  • Computing your t by hand then using the T.DIST.2T function to get your exact p (x is your t - don't ask me why they didn't just use t instead of x in the arguments; maybe because Excel was not created by or for statisticians)
(Note: If you get into conducting statistics, Excel is not a good tool, especially for more advanced stats. But for basic demonstrations like this, it's fine.)

Bonus points if you do the t-test while drinking a beer (Guinness if you really want to be authentic).

T is for T-Test

And now the long-awaited post about the intersection of two things I love: statistics and beer. In fact, as I was working on this post Sunday evening, I was enjoying a Guinness:


I'll get to why I specifically chose Guinness in a moment. But first, let's revisit our old friend, the standard normal distribution:


This curve describes the properties of a normally distributed variable in the population. We can determine the exact proportion of scores that will fall within a certain area of the curve. The thing is, this guy describes population-level data very well, but not so much with samples, even though the sample would be drawn from the population reflected in this curve. Think back to the post about population versus sample standard deviation; samples tend to have less variance than populations. The proportions in certain areas of the standard normal distribution are not just the number of people who fall in that range; they are also the probabilities that you will end up with a person falling within that range in your sample. So you have a very high probability of getting someone who falls in the middle, and a very low probability of getting someone who falls in one of the tails.

Your sample standard deviation is going to be an underestimate of the population standard deviation, so we apply the correction of N-1. The degree of underestimation is directly related to sample size - the bigger the sample, the better the estimate. So if you drew a normal distribution for your sample, it would look different depending on the sample size. As sample size increases, the distribution would look more and more like the standard normal distribution. But the areas under different parts of the curve (the probabilities of certain scores) would be different depending on sample size. So you need to use a different curve to determine your p-value depending on your sample size. If you use the standard normal distribution instead, your p-values won't be accurate.

In the early 1900s, a chemist named William Sealy Gosset was working at the Guinness Brewing Company. Guinness frequently hired scientists and statisticians, and even allowed their technical staff to take sabbaticals to do research - it's like an academic department but with beer. Gosset was dealing with very small samples in his research on the chemical properties of barley, and he needed a statistic (and distribution) that would allow him to conduct statistical analyses with a very small number of cases (sometimes as few as 3). Population-level tests and distributions would not be well-suited for such small samples, so Gosset used his sabbatical to spend some time at University College London, developed the t-test and t-distribution, and published his results to share with the world. (You can read the paper here.)

Every person who has taken a statistics course has learned about the t-test, but very few know Gosset's name. Why? Because he published the paper under the pseudonym "Student" and to this day, the t-test is known as Student's t-test (and the normal curves the Student's t-distribution). There are many explanations for this, and unfortunately, I don't know which one is accurate. I had always heard the first one, but as I did some digging, I found other stories:
  • Gosset feared people wouldn't respect a statistic created by a brewer, so he hid his identity
  • Guinness didn't allow its staff to publish
  • Guinness did allow staff to publish, but only under a pseudonym
  • Gosset didn't want competitors to know Guinness was using statistics to improve brewing
I'd like to show you a worked example, but since this post is getting long, I'm going to stop here. But I'll have a second post this afternoon showing a t-test in action (if you're into that kind of thing). Stay tuned!

Friday, April 14, 2017

L is for Law of Large Numbers

The dice may have no memory, but probability wins in the end.

That's probably the best way to describe the law of large numbers, which states that as you repeat the same experiment, coin flip, dice roll, etc., the results will get closer and closer to the expected value. Basically, the more times you repeat something, the closer you will get to the truth. You may get 6 heads in a row when you flip a coin, but if you flip 1,000 times, you'll probably be very close to 50/50.

In fact, just for fun, I went to Random.org's Coin Flipper, which let me flip 100 coins at once. (Yes, this is what I do for fun.) After the first 100 flips, I had 46 heads, 54 tails. After 500 flips, I had 259 heads (51.8%) and 241 tails (48.2%). If I kept flipping, I would have eventually gotten to 50/50.

We use this probability theory in statistics and research all the time. Because as our sample size gets closer to the population size, the closer our results will be to the true value (the value we would get if we could measure every single case in our population). Relatedly, as our sample size increases, the closer the sample distribution will be to the actual population distribution. So if a variable is normally distributed in the population, then as sample size increases, our sample will also take on a normal distribution.

While that magic number (the sample size needed) to get a good representation of the population will vary depending on a number of factors, the convention is not as big as you might think - it's 30.


That's right. Recognizing that all kinds of crazy things can happen with your sample (because probability), 30 cases is about all you need to get a good representation of the underlying population. That information, however, shouldn't stop you from doing the unbelievably important step of a power analysis.

I'll be talking more about population and sample distributions, like those pictured, soon. Sneak preview - one of them has to do with beer.

Thursday, February 23, 2017

Dem Bones, Dem Bones, Dem Dinosaur Bones

For the first time, the Field Museum is releasing specimens for public viewing off site. In a unique collaboration, a pop-up bar/museum exhibit will be opening inside the Chicago Athletic Association:
As with any nonpermanent exhibition, catch it while you can: The Backroom will be open Friday and Saturday nights only and will close a month after it begins, on March 25. The space can comfortably hold 150 people.

Guests can view everything from glowing rocks to dinosaur fossils to pinned butterflies, while sipping cocktails created by Paul McGee, who runs Milk Room, Game Room and Cherry Circle Room in the CAA (as well as Lost Lake in Logan Square). McGee's Negroni (gin, vermouth, Gran Classico Bitter) and Amaro Mule (Luxardo Amaro Abano, Luxardo Bitter, Fever Tree ginger beer) feature botanical ingredients such as juniper, roots, flowers and bark, all hearkening to the Backroom's specimen-focused theme. Beer and wine will also be available.
Field Museum scientists will be present to chat and lead discussions and activities. Oh yeah, and they promise karaoke and trivia at some point. Should be fun!